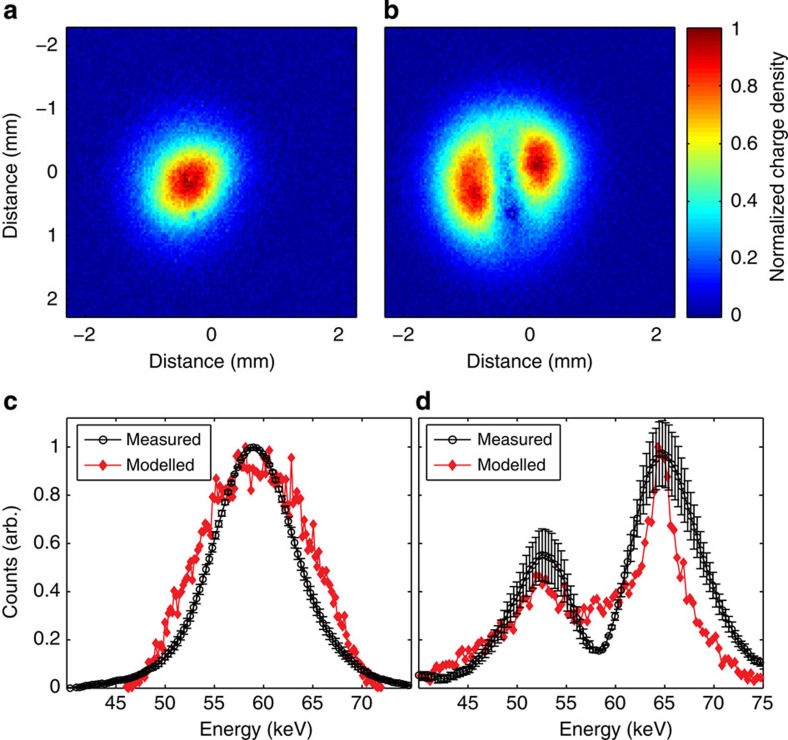
Figure 2. Demonstration of terahertz acceleration.
Transverse electron density of the electron bunch as recorded by a micro-channel plate (MCP) at 59 kV for (a) THz off and (b) THz on. The bimodal distribution is due to the presence of accelerated and decelerated electrons, which are separated spatially by the magnetic dipole energy spectrometer. The images are recorded over a 3-s exposure at 1 kHz repetition rate. (c) Comparison between simulated (red) and measured (black) energy spectrum of the electron bunch measured at the MCP due to the deflection of the beam by a magnetic dipole. At 59 keV and with 25 fC per bunch, the simulation predicts a σ⊥=513 μm and ΔE=1.25 keV. The observed ΔE/E appears larger due to the large transverse size of the beam. After the pinhole, the transverse emittance is 25 nm rad and the longitudinal emittance is 5.5 nm rad. (d) Comparison between simulated (red) and measured (black) electron bunch at MCP after acceleration with THz. Decelerated electrons are present due to the long length of the electron bunch, as well as the slippage between the THz pulse and the electron bunch. Error bars in c and d correspond to one s.d. in counts over the data set of 10 integrated exposures.

