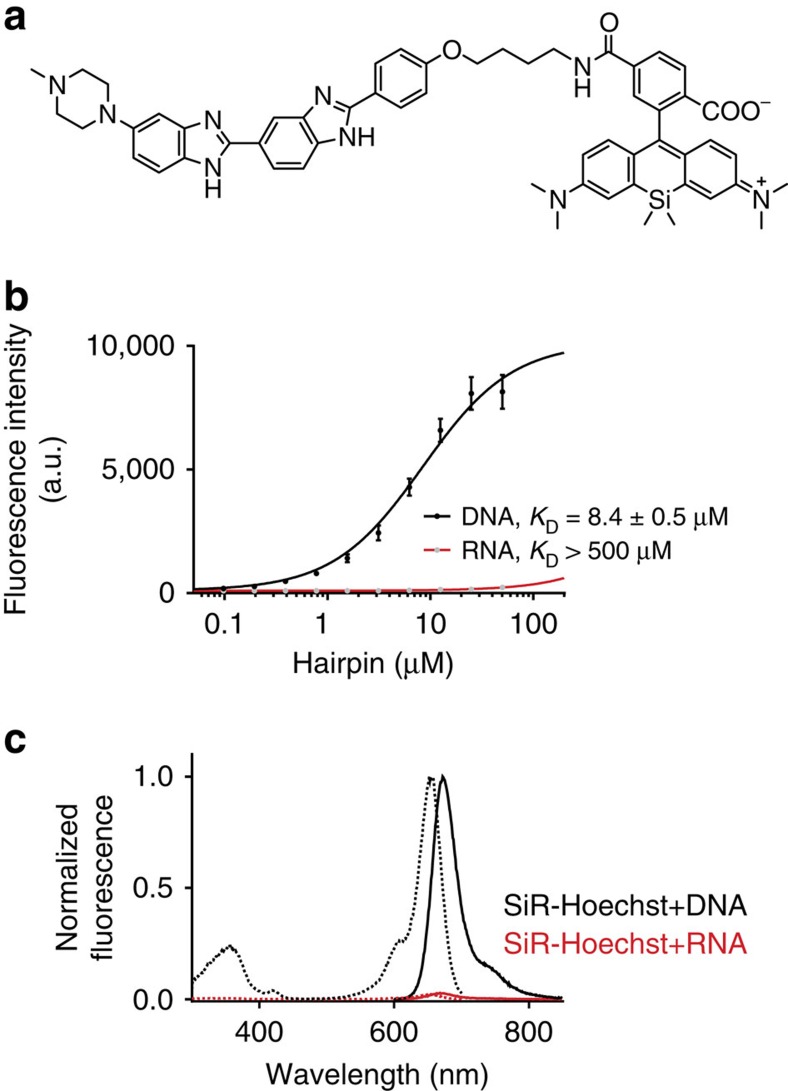
Figure 1. SiR–Hoechst.
(a) Structure of the SiR–Hoechst. (b) Titration of 0.1 μM SiR–Hoechst probe with varying concentrations of hairpin DNA or hairpin RNA. Data points represent mean±s.d. of three independent replicates measured in triplicates. (c) Excitation spectra and absorbance spectra of 1 μM SiR–Hoechst in presence of 50 μM hairpin DNA or RNA. Determined excitation maximum at 652 nm and emission maximum at 672 nm.

