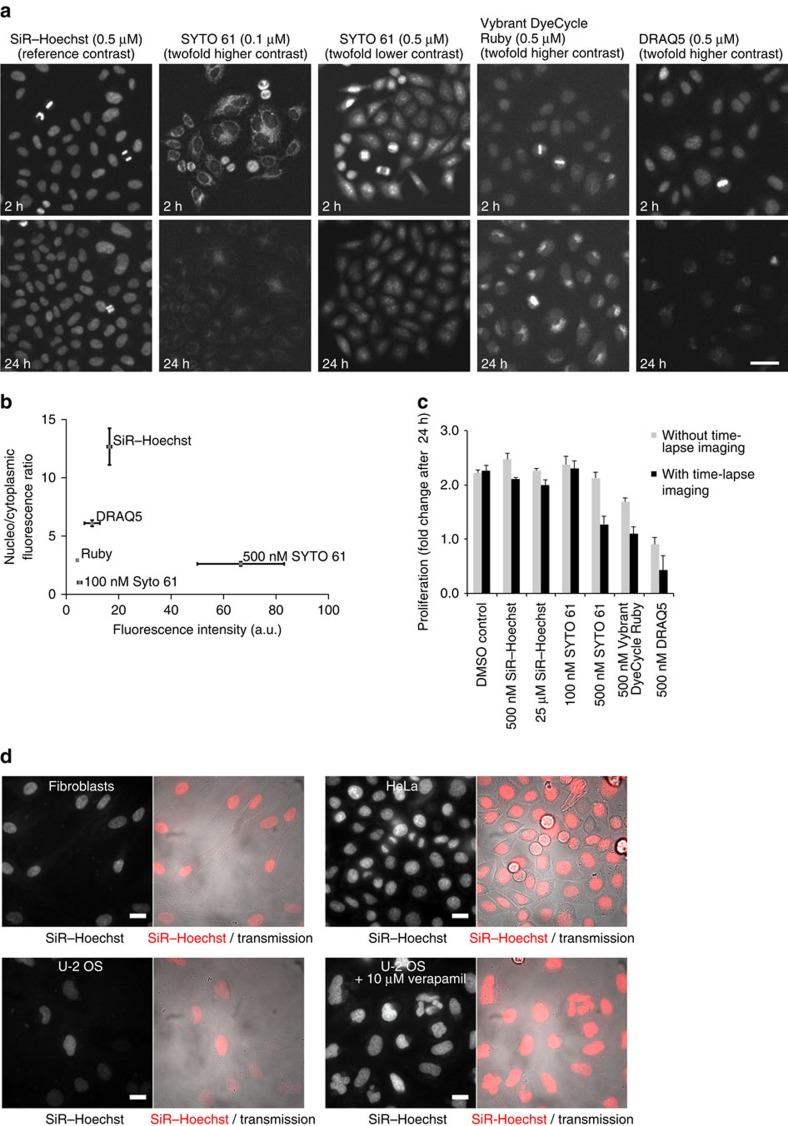
Figure 2. Live-cell imaging with SiR–Hoechst.
(a) Long-term live-cell microscopy with SiR–Hoechst and other far-red DNA dyes. HeLa cells were imaged for 24 h on a wide-field epifluorescence microscope in presence of the dyes at the indicated concentrations, with a time lapse of 5.0 min. The contrast was linearly adjusted for the different dyes as indicated relative to the reference contrast used to display SiR–Hoechst (0.5 μM). Scale bar, 50 μm. (b) Quantification of nuclear-staining intensity and specificity. Nuclei were automatically segmented based on the H2B-mCherry channel and the mean fluorescence intensity was then quantified in the channel used for imaging far-red DNA dyes. The staining specificity was calculated as the ratio of nuclear mean fluorescence divided by cytoplasmic mean fluorescence quantified in a narrow area surrounding the nucleus. Spots indicate mean and bars indicate s.e.m. of three independent biological replicates; >1,108 cells per replicate. (c) Quantification of cell proliferation based on the last and the first frames of the live-cell movies shown in a. To assess phototoxicity caused by time-lapse imaging, separate wells in the imaging plate were exposed to fluorescence excitation light only at 0 and 24 h time points. Bars show mean±s.d. of three independent biological replicates; >76 cells per replicate. To quantify cells with no or low staining in the far-red channel, a stably expressed histone 2B (H2B)-mCherry was used as a reference chromatin marker. (d) Images of different cell types with 4 μM SiR–Hoechst. Scale bar, 20 μm.

