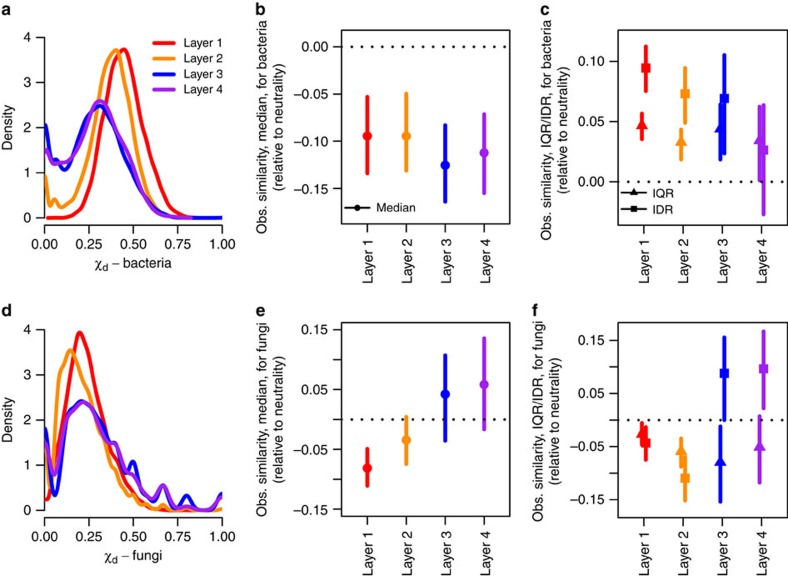
Figure 3. Distributions of pairwise similarities between microbial communities and effect sizes relative to a null model based on neutral community assembly.
Community similarities (Xd) for bacteria (a–c) and fungi (d–f) are based on the Sørensen index. Distributions of observed community similarities within each of the four soil layers are presented as probability densities (a,d). The mean (points) and 95% confidence interval (vertical lines) of the central tendency (b,e) and dispersion (c,f) of observed community similarities are presented relative to 100 simulations under the null model. Here, a reduction or increase in the central tendency is evidence of, in general, convergence upon or divergence from a common community composition, respectively. A reduction/increase in dispersion is further evidence of convergence/divergence, with a focus on extremes of the distribution; the interquartile range (IQR) and the interdecile range (IDR) provides estimates of dispersion in the middle 50 and 80% of the distribution, respectively.

