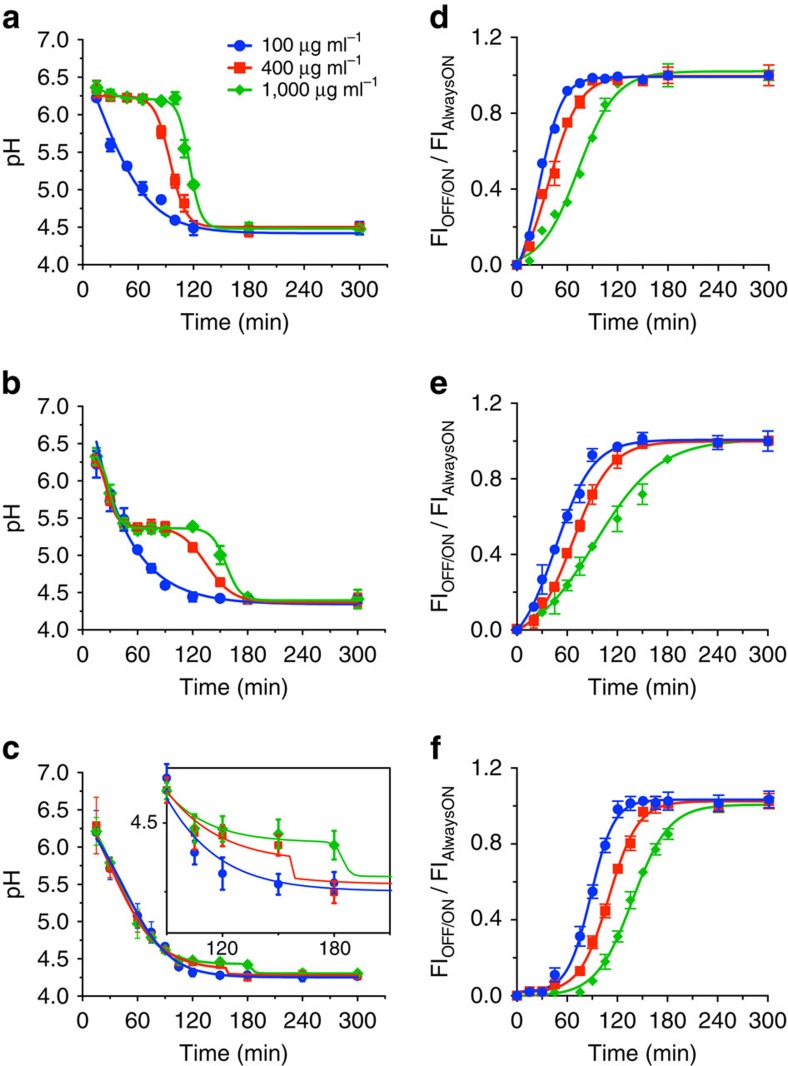
Figure 2. pH-sensitive buffering of endocytic organelles in HeLa cells.
Real-time measurement of endo/lysosomal pH in HeLa cells treated with the indicated doses of UPS6.2 (a), UPS5.3 (b) and UPS4.4 (c). The inset is a zoomed-in view of the curve from pH 4.1 to 4.7 and 90 to 210 min in c. Lysosensor ratiometric imaging probe was used for in situ pH measurement. Quantitative analyses of the activation kinetics of always-ON/OFF-ON UPS6.2 (d), UPS5.3 (e) and UPS4.4 (f). The fluorescent intensity of punctae in BODIPY channel (OFF-ON) was normalized to that of Cy3.5 (always-ON). The error bars represent s.d. from 50 organelles at each time point. In a and b, the 100 μg ml−1 curves are significantly different from the 400 and 1,000 μg ml−1 ones, with a P-value <0.0001, whereas in c, the 100 μg ml−1 curve is significantly different from the 400 and 1,000 μg ml−1 ones at 120 and 180 min time points, with a P-value <0.05. Two-way analysis of variance and Dunnett's multiple comparison tests were performed to assess the statistical significance. Blue, red and green plots indicate 100, 400 and 1,000 μg ml−1 of UPS nanoparticles in all panels.

