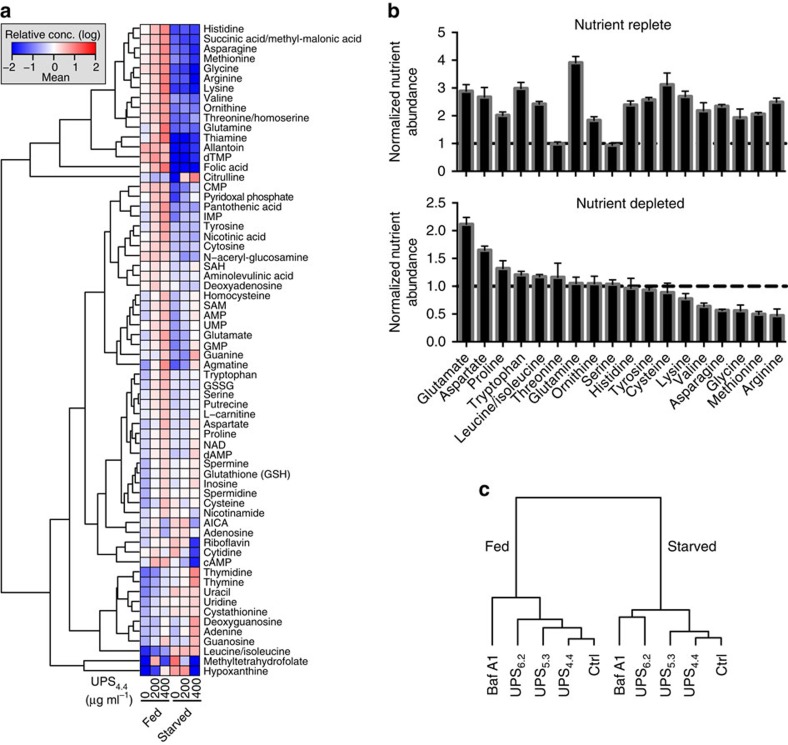
Figure 5. Selective buffering of lysosomal pH modulates the cellular metabolite pool.
(a) Dendrogram indicates relative abundance of the indicated metabolites in nutrient replete (fed) or deprived (starved) medium as normalized to the total protein content. Cells were treated with UPS4.4 at the indicated doses. (b) Normalized abundance of the selected amino acids under nutrient replete and nutrient-deprived conditions. Error bars represent s.d., n=6. (c) An unsupervised hierarchical clustering of different treatments including 1,000 μg ml−1 UPS6.2, UPS5.3 and UPS4.4 or 100 nM baf A1 under fed and starved conditions. Dentrogram was generated based the abundance of 108 metabolites.

