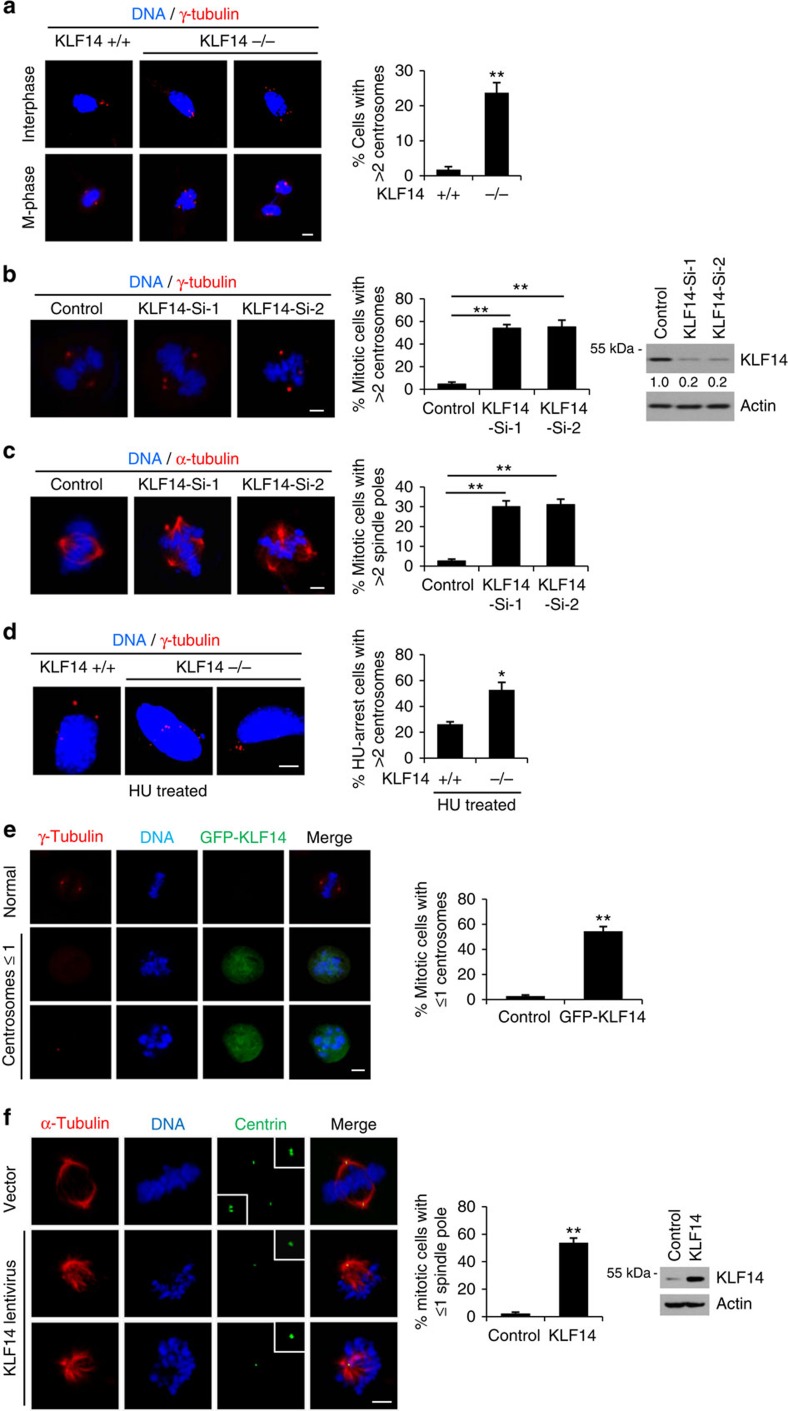
Figure 3. KLF14 regulates centrosome integrity and mitosis.
(a–d) KLF14 reduction induces centrosome amplification. (a) Representative images show centrosome morphologies in KLF14-WT and -KO passage 3 (P3) MEFs (scale bar, 5 μm). Centrosomes and DNA were costained with anti-γ-tubulin antibody (red) and 4,6-diamidino-2-phenylindole (DAPI, blue), and visualized by fluorescence microscopy. Bar graphs show fraction of MEFs containing extra centrosomes. More than 100 cells per experimental group were counted; data represent mean±s.d., **P<0.01. (b,c) HeLa cells were infected with pLKO.1 vector (Control) or KLF14-knockdown (Si-1 or Si-2) lentivirus for 72 h. Centrosomes (b) and spindles (c) were stained with γ-tubulin (red) and α-tubulin (red), respectively (scale bar, 5 μm). DNA was stained with DAPI. Bar graphs show fraction of cells with indicated events. More than 100 cells per condition were counted from 3 independent experiments, **P<0.01. Representative western blotting showing KLF14 knockdown efficiency. (d) MEF cells from KLF14-WT and -KO mice were treated with 4 mM HU for 40 h and analysed for centrosome amplification. Centrosomes and DNA were stained and visualized as in a (scale bar, 5 μm). Bar graphs showing fraction of HU-treated cells containing extra centrosomes. More than 100 cells per condition were counted from 3 independent experiments, *P<0.05, **P<0.01. (e,f) KLF14 overexpression causes centrosome and spindle pole defects. (e) HeLa cells were transfected with vector (Control) or GFP-KLF14 plasmids for 48 h. Centrosomes and DNA were stained and visualized as in a (scale bar, 5 μm). Graphs show fraction of cells with aberrant centrosome in mitosis. More than 100 cells per experimental group were counted from 3 independent experiments, **P<0.01. (f) HeLa cells were infected with vector or KLF14 overexpression lentivirus for 48 h. Spindles poles, centrioles and DNA were costained with α-tubulin (red), centrin (green) and DAPI (blue), and visualized by fluorescence microscopy (scale bar, 5 μm). The boxed enlargements show centriole pairs in cells. Bar graphs show fraction of cells with aberrant spindle pole numbers in mitosis. More than 100 cells per experimental group were counted from 3 independent experiments, **P<0.01. Representative western blotting showing KLF14 expression.

