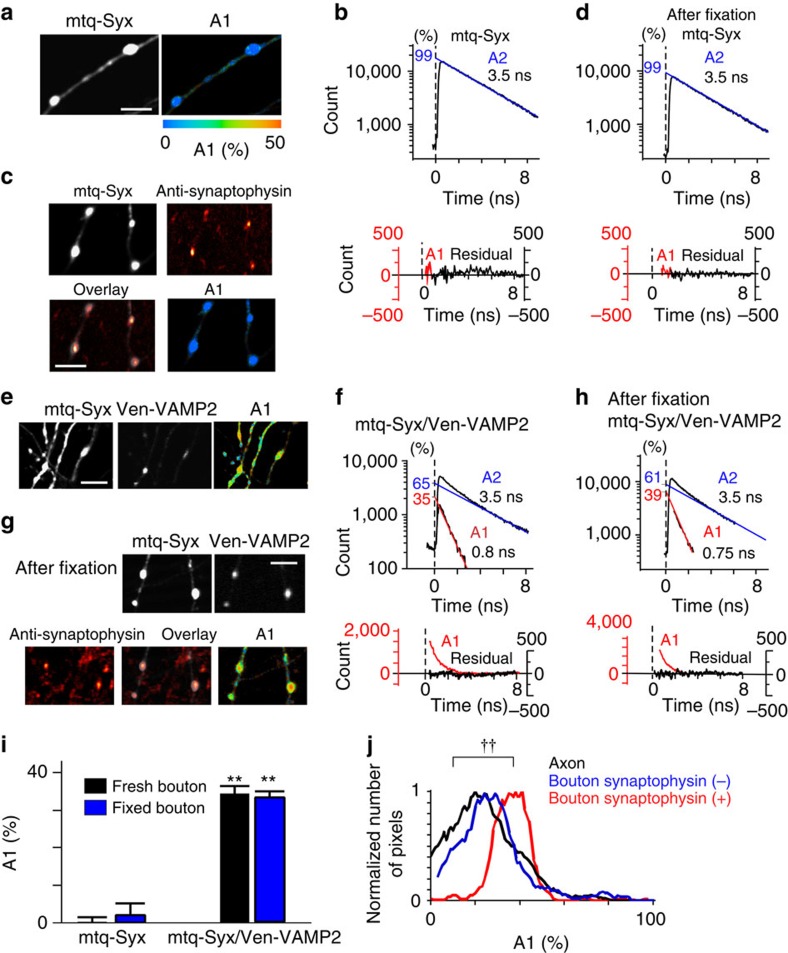
Figure 2. FRET/2pFLIM of the SNARE complexes between mtq-Syx and Ven-VAMP2 in neurons.
(a,c) Fluorescence and A1 fraction images of mtq-Syx-expressing boutons (scale bars, 5 μm). Preparations were live-imaged in a and were imaged after chemical fixation and counterstaining with anti-synaptophysin antibody in c. (b,d) Lifetime decay curves of mtq-Syx obtained from 14 boutons. (e,g) Fluorescence and A1 fraction images of mtq-Syx/Ven-VAMP2-stained boutons (scale bars, 5 μm). Preparations were live-imaged in e and were imaged after chemical fixation and counterstaining with anti-synaptophysin antibody in g. (f,h) Lifetime decay curves of mtq-Syx/Ven-VAMP2 obtained from 12 live boutons and 8 fixed boutons. (i) The A1 fractions of mtq-Syx (black bar; mean±s.e.m.=0.18±1.4%; 14 boutons) or after fixation (blue bar; 2.4±2.9%; 14 boutons) and mtq-Syx/ven-VAMP2-stained boutons in live images (black bar; 34.1±2.0%; 21 boutons) and after fixation (blue bar; 33.2±1.3%; 19 boutons) at the endogenous expression level of VAMP2 (Supplementary Fig. 3b). The A1 fractions for mtq-Syx/Ven-VAMP2 were significantly different from 0% (**P=0.0004 and **P=0.0001 using the Wilcoxon signed-rank test). The A1 fraction was not affected by fixation (P=0.74 using the Mann–Whitney U-test). (j) Distributions of the A1 fractions in the boutons among the pixels positive (red; 38.8±1.8%; 519 pixels) or negative (blue; 17.4±2.2%; 323 pixels) for anti-synaptophysin staining or in axons (black; 15.6±2%; 183 pixels; P=0.0002 using the Kruskal–Wallis test; P=0.75 and ††P=0.0039 for boutons negative and positive for synaptophysin versus axons using Steel's test).

