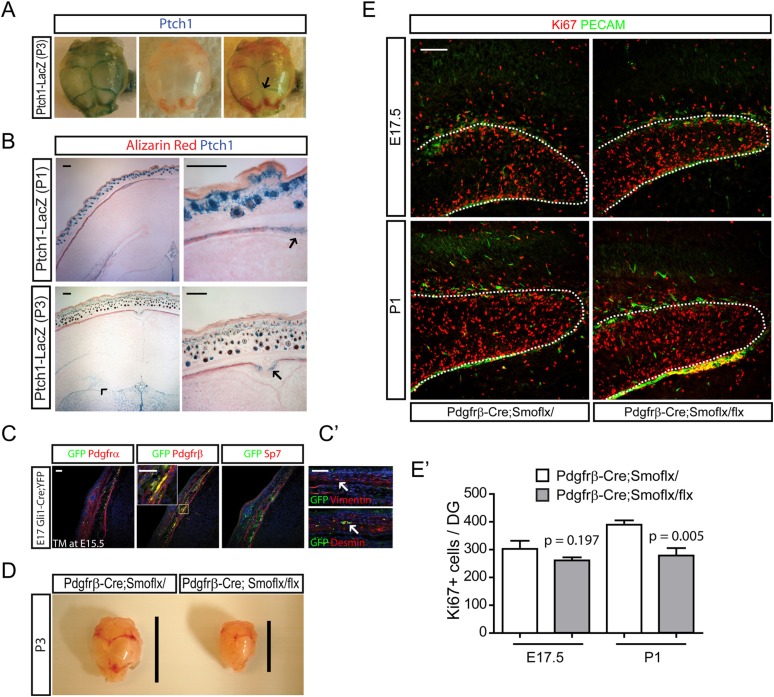
Figure 5. Development of perinatal dentate progenitors by inhibition of hedgehog signaling in the dermal mesenchyme.
(A) Ptch1-LacZ expression in the calvarium is presented. Arrow indicates X-gal staining of Ptch1-LacZ in the calvarial suture. (B) Ptch1-LacZ expression was detected in the fronts of developing calvarial bones (arrows). Ptch1-LacZ + dentate progenitors are obvious at P3 (arrow head). Fetal mouse heads were stained with X-gal and Alizarin red to counter-stain the calvarial bone. (C) Hedgehog-responding cells and their descendants in the calvarial and dermal mesenchymes are presented using E17.5 Gli1-CreERt2;Rosa-Yfp embryos that was injected with TM at E15.5. Sections were stained for GFP to label hedgehog-responding cells with mesenchymal markers such as Pdgfrα, Pdgfrβ (dermal mesenchyme, meninges), and Sp7 (calvarial mesenchyme). Inset shows co-localization of GFP and Pdgfrβ. (C′) GFP + cells were stained with pericyte markers such as Desmin and Vimentin. GFP + vascular cells are noted (arrows). (D) Hypoplasic skull bone development in the Pdgfrb-Cre;Smoflx/flx mutant at P3. Lines indicate the length of skull bones. (E) Dentate progenitors were stained for Ki67 using E17.5 and P1 Pdgfrb-Cre;Smoflx/+ and Pdgfrb-Cre;Smoflx/flx embryos. Dentate blood vessels were counter-stained with PECAM to outline the dentate (dashed lines). (E′) Four different litters were used to measure the decrease of dentate progenitors in the mutant (n = 4). Student t-test was used to test the significant difference of the number of Ki67 + cells. p values are presented in the graph. Scale bars: B, E = 200 μm, C, C′ = 100 μm.

