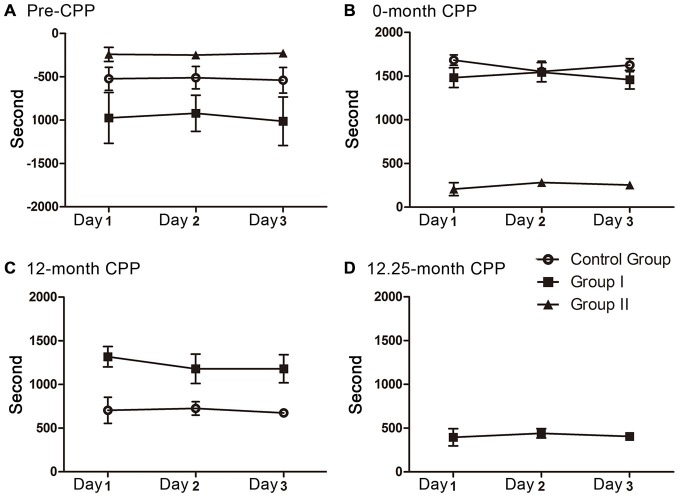
Figure 2.
The preference scores in the 3 days of each CPP testing. No decay was found during each testing. (A) The preference scores of the three groups before CPP conditioning (F(2, 9) = 0.012, P = 0.989 for control group, F(2, 12) = 0.031, P = 0.970 for group I, F(2, 6) = 0.039, P = 0.962 for group II). (B) The preference scores of the three groups during the 0 month-CPP phase (F(2, 9) = 0.561, P = 0.590 for control group, F(2,12) = 0.158, P = 0.855 for group I, F(2, 6) = 0.473, P = 0.645 for group II). (C) The preference scores of group I and control group during the 12 month-CPP phase (F(2, 9) = 0.068, P = 0.935 for control group, F(2,12) = 0.283, P = 0.759 for group I). (D) The preference scores of group I during the 12.25 month-CPP phase (F(2, 12) = 0.118, P = 0.890).

