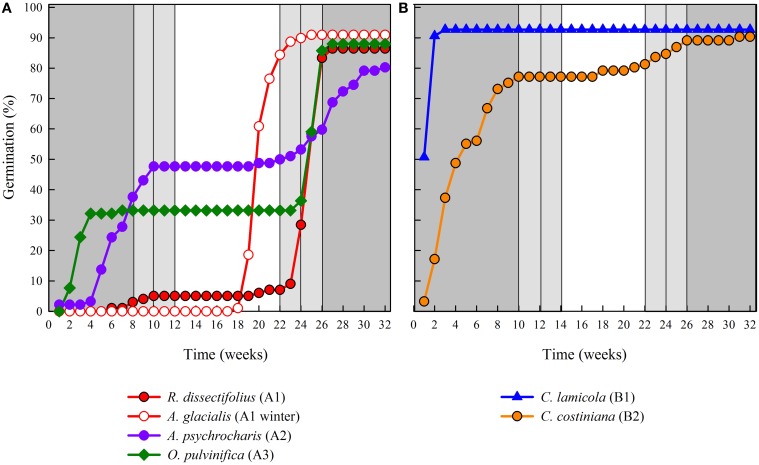
Figure 3.
Cumulative percentage germination of one representative species from each germination cluster. (A) cluster A, species that postponed germination, (B) cluster B, species that germinated immediately. Note that staggered germination patterns are nested within the above clusters. Incubator temperature regimes are represented by shading (see Figure 1).

