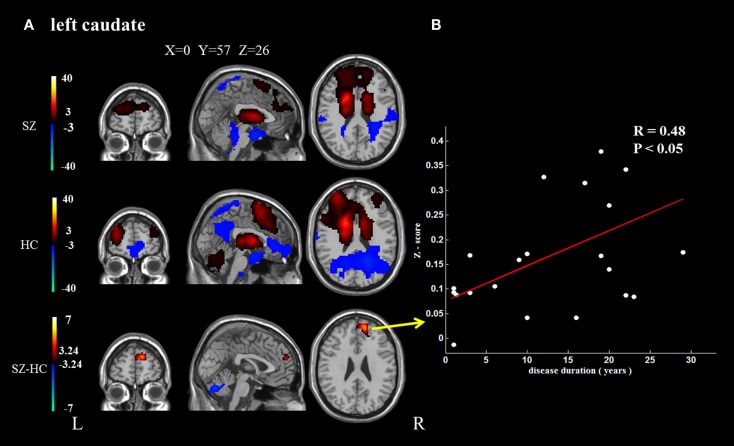
Figure 3.
The brain regions that exhibit significant differences between the two groups in the functional connectivity maps (cluster level FDR corrected, p < 0.05, the initial height threshold is p < 0.001). (A) The significantly altered functional connectivity between the left caudate nucleus and the superior frontal gyrus, cerebellum. Moreover, the functional connection between the left caudate nucleus and the superior frontal gyrus exhibited a positive association with the duration of the disease. (B) The significantly altered functional connectivity between the right caudate nucleus and the superior frontal gyrus, cerebellum and the supplementary motor area, and middle cingulate cortex. Moreover, the functional connection between the right caudate nucleus and the superior frontal gyrus exhibited a positive association with the duration of the disease.

