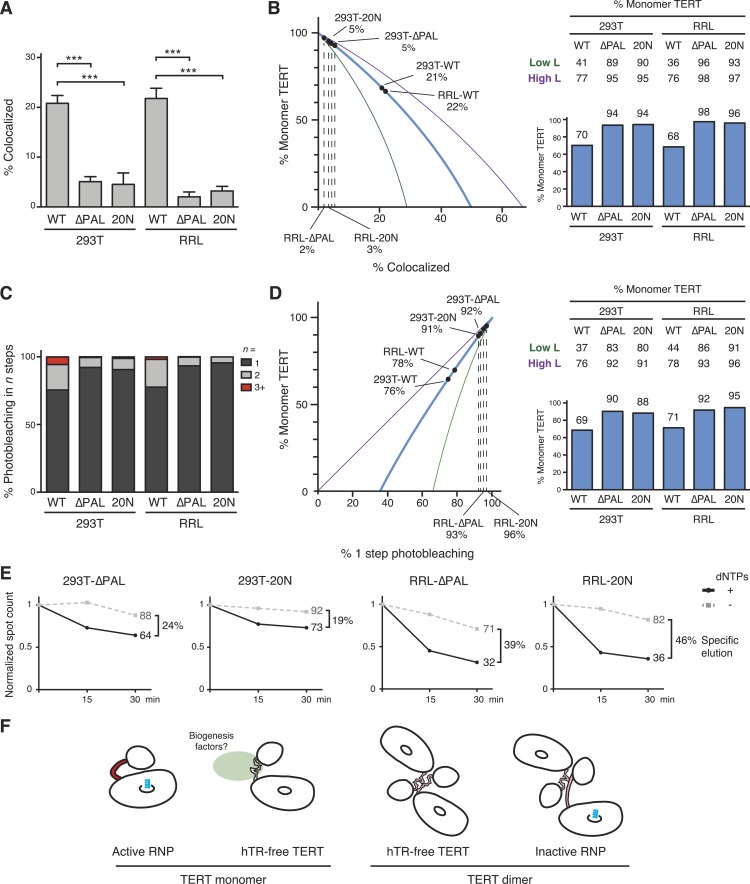
Figure 7. PAL-mediated TERT dimerization.
(A) Two-color co-localization quantification for DNA-bound O-purified complexes of coexpressed ACP- and MCP-TERTs. Values are the average of triplicate experimental replicates. ***p < 0.001 using one-way ANOVA, followed by Tukey's multiple comparison test. (B) Calculated percentage of DNA-bound TERT monomer complexes according to the fraction of two-color TERT co-localization (percentages indicated), assuming the TERT-labeling efficiency measured value (82%, blue line; bar graph at right), lower bound (51%, green line; Low L numbers at right), or upper bound (100%, purple line; High L numbers at right). (C) Photobleaching step quantification for DNA-bound O-purified MCP-TERT complexes labeled with Cy5. Values are the average of triplicate experimental replicates. (D) Calculated percentage of DNA-bound TERT monomer complexes according to the fraction of one-step photobleaching (percentages indicated), assuming the TERT-labeling efficiency measured value (82%, blue line; bar graph at right), lower bound (51%, green line; Low L numbers at right), or upper bound (100%, purple line; High L numbers at right). (E) Activity-dependent elution of O-purified Cy5-labeled MCP-TERT complexes using buffer containing dATP + dTTP or buffer only. Spot count per field of labeled TERT complexes was normalized to the initial time point of each sample. Specific elution was calculated by subtracting the fraction of complexes with buffer-only elution from the fraction eluted with dNTPs. (F) Illustration presenting the hypothesis of differences in TERT PAL conformation that occur with TERT RNP assembly or dimerization. The PAL is shown with conformations that correlate with catalytically active (red) or inactive (pink) TERT complexes.

