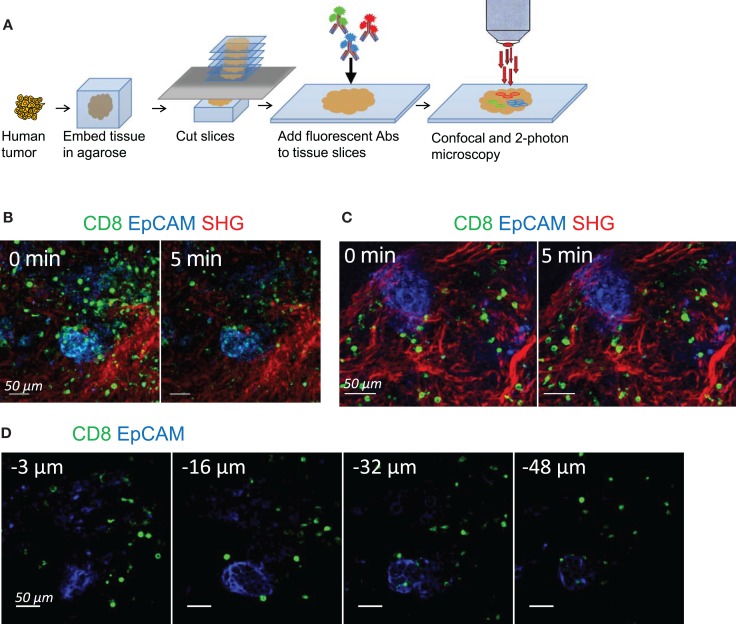
Figure 1.
Tracking resident CD8 T cell motility in human tumors. (A) Experimental setup. Tissue slices were prepared from human lung and ovarian tumors by means of a vibratome. Slices were then stained with conjugated antibodies and imaged through confocal and two-photon microscopy. (B) Snapshots of two-photon images of an ovarian tumor slice stained for CD8 (green) and EpCAM (blue) to identify tumor cell regions. SHG (red) was used to visualize the collagen network. See also Movie S1 in Supplementary Material. (C) Snapshots of confocal images of an ovarian tumor slice stained for CD8 (green) and EpCAM (blue) to identify tumor cell regions. Second-harmonic generation images (red) captured with a two-photon microscope were superimposed to the confocal images. See also Movie S2 in Supplementary Material. (D) Snapshots of confocal images of an ovarian tumor slice stained with the indicated antibodies and captured at different depths from the cut surface. See also Movies S3 and S4 in Supplementary Material.

