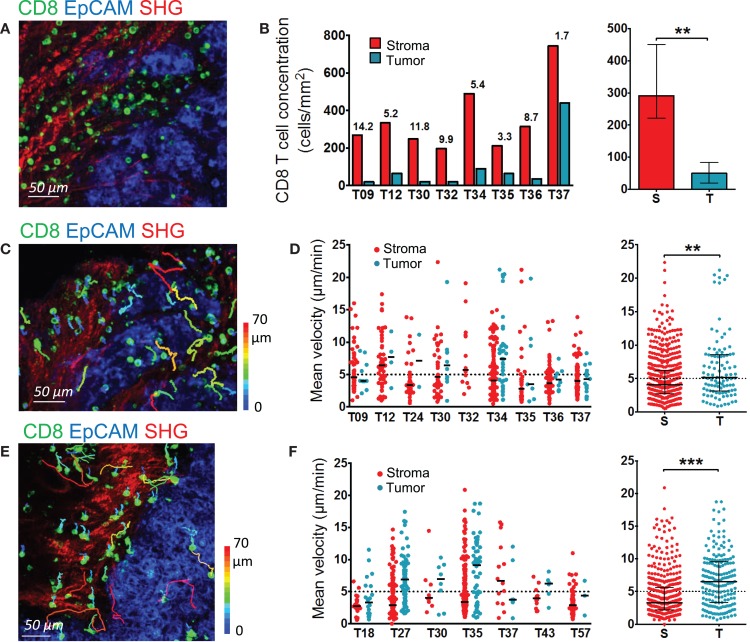
Figure 2.
Distribution and migration of resident CD8 T cells in human ovarian and lung tumors. (A,B) Distribution of resident CD8 T cells in human ovarian tumors. (A) Representative image of a human ovarian tumor slice stained for EpCAM (blue) and CD8 (green). The SHG signal is in red. (B) Concentration of resident CD8 T cells in the stromal and tumor cell regions of human ovarian carcinomas. Left panel: CD8 density in stromal (red) and tumor cell (blue) regions for individual tumors. Numbers indicate the fold increase of CD8 T cells in stromal regions over tumor islets. Right panel: pooled values, median ± interquartile range. (C,D) Motility of resident CD8 T cells in human ovarian tumors. (C) Trajectories of individual resident CD8 T cells in the stromal (red) and tumor cell (blue) regions of a human ovarian carcinoma slice. See also Movie S5 in Supplementary Material. The slice was stained with the indicated antibodies and imaged for 30 min with a confocal microscope. The SHG signal was recorded at the end with a two-photon microscope. Tracks are color-coded according to CD8 T cell displacement length. (D) Left panel: medians of mean velocities of resident CD8 T cells in the stromal and tumor cell regions of individual human ovarian carcinomas. Right panel: pooled values, medians ± interquartile. (E,F) Motility of resident CD8 T cells in human lung tumors. (E) Trajectories of individual resident CD8 T cells in the stromal (red) and tumor cell (blue) regions of a human lung carcinoma slice. The slice was stained with the indicated antibodies and imaged for 20 min with a confocal microscope. The SHG signal was recorded at the end with a two-photon microscope. Tracks are color-coded according to CD8 T cell displacement length. (F) Left panel: medians of mean velocities of resident CD8 T cells in the stromal and tumor cell regions of individual human lung carcinomas. Right panel: pooled values, medians ± interquartile. Mann–Whitney test, *P < 0.05; **P < 0.01; ***P < 0.001.

