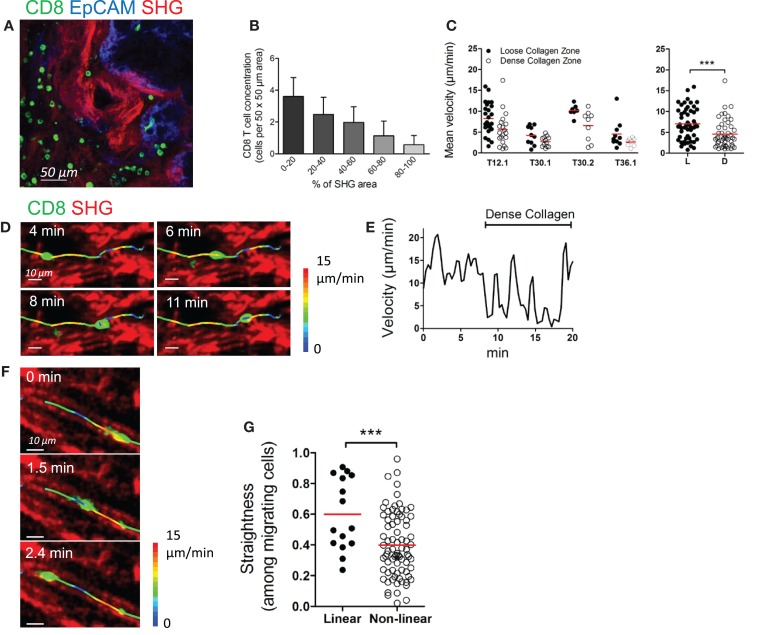
Figure 3.
Collagen fibers control the distribution and migration of CD8 T cells in the stroma of human ovarian carcinoma. (A) Human ovarian tumor slice stained for CD8 (green) and EpCAM (blue), showing accumulation of resident CD8 T cells in collagen-loose regions. Collagen (red) has been imaged through SHG. (B) Automatically counted number of resident CD8 T cells in different 50 μm × 50 μm stromal regions classified according to the surface (%) occupied by collagen detected through SHG. Results were obtained on slices from four different ovarian tumors. (C) Left panel: mean velocities of resident CD8 T cells in loose and dense collagen areas of individual human ovarian carcinomas. Right panel: pooled values, mean ± SD. (D–G) Motile behavior of resident CD8 T cells relative to collagen fibers. (D) Snapshots are shown at various time intervals for the same CD8 T cell. The trajectory of this CD8 T cell was superimposed over SHG images. The track is color-coded according to the instantaneous velocity. See also Movie S11 in Supplementary Material. (E) Velocity of the CD8 T cell represented in (D). (F) Snapshots are shown at various time intervals for the same CD8 T cell located in a linear collagen region. The trajectory of the CD8 T cell was superimposed over SHG images. The track is color-coded according to the instantaneous velocity. See also Movie S12 in Supplementary Material. (G) The graph shows the straightness index of individual tracks of CD8 T cells in linear and non-linear collagen fiber regions. Straightness indices close to 1 correspond to linear trajectories. Values are compiled from four different ovarian tumors. Mann–Whitney test, *P < 0.05; **P < 0.01; ***P < 0.001.

