Figure 4.
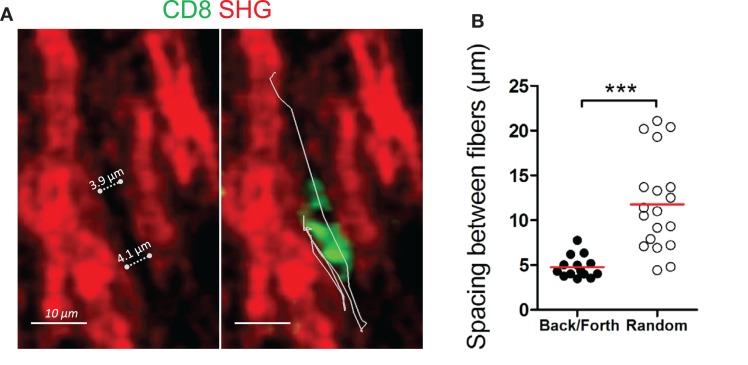
Back and forth migration of resident CD8 T cells in the stroma of human ovarian carcinomas. (A) Representative image of a resident CD8 T cell that exhibits a back and forth migration mode relative to collagen fibers. See also Movie S13 in Supplementary Material. Left: SHG signal (red) alone. Dotted lines indicate the spacing between collagen fibers. Right: same SHG image as in left but with a CD8 T cell (green) and its trajectory (white line) during a 17-min recording. (B) Spacing between collagen fibers are shown for CD8 T cells that display either back and forth or random migration. The durations of the tracks were non-significantly different within the two groups (13.5 ± 2.6 min for CD8 T cells that exhibit back and forth migration vs. 16.8 ± 2.6 min for CD8 T cells that migrate randomly). Values are compiled from four different ovarian tumors. t-test, *P < 0.05; **P < 0.01; ***P < 0.001.

