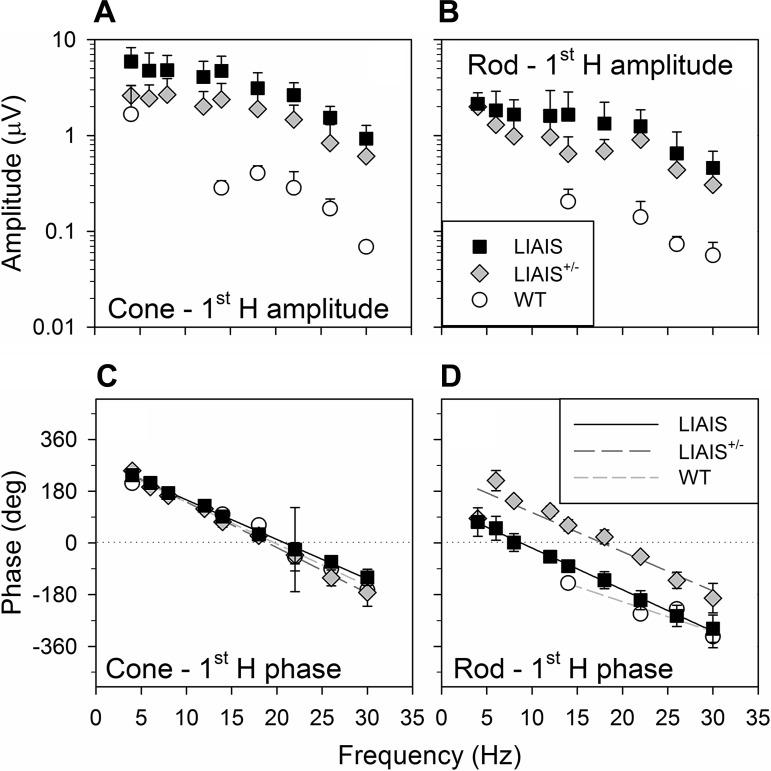
Fig. 2.
Fundamental ERG parameters (first harmonic, 1st H) of responses from each mouse strain. Data are averages (±SD) plotted as a function of temporal frequency from LIAIS (black squares; L*-cone, n = 11; rod, n = 10), LIAIS+/− (gray diamonds; L*-cone, n = 6; rod, n = 5), and WT mice (open circles; M-cone, n = 2; rod, n = 4) that were obtained with the highest stimulus contrast measured (cone: 55% for mutants and 5% for WT; rod: 75% for mutants and 5% for WT) under a mean luminance condition of 39 cd/m2. Cone (A)- and rod-driven (B) response amplitudes were largest in LIAIS mice. The response amplitudes were relatively constant up to a frequency of about 15 Hz (possibly with a local minimum at about 10 Hz) and decreased with increasing stimulus frequency above 15 Hz. Those obtained from the LIAIS+/− group were approximately half the size, whereas WT mice showed responses that were smaller by about a factor of 10 and just above noise. Phases are shown in C and D, described with linear regressions (LIAIS, black solid lines; LIAIS+/−, dark gray long-dashed lines; WT, light gray short-dashed lines). The phases of the cone-driven responses are shifted by 180° to account for the counter phase modulation of the rods and cones. Similar frequency dependency of the phases is shown in LIAIS and WT mice, whereas those obtained from the LIAIS+/− mice are about 180° shifted.

