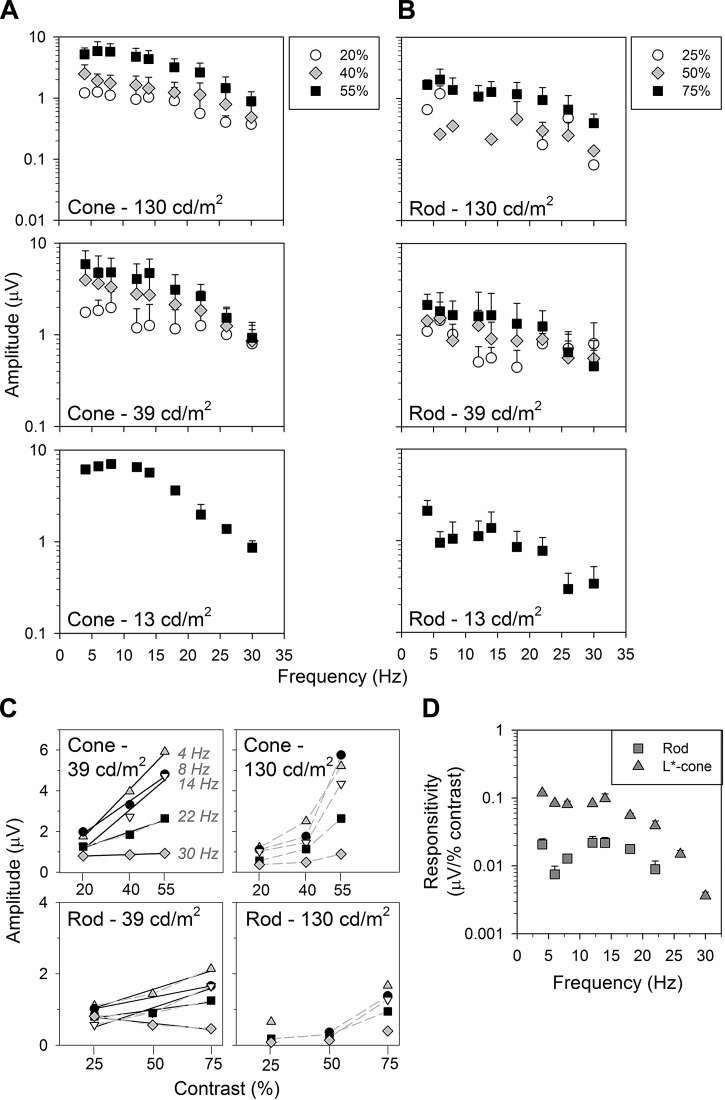
Fig. 4.
Amplitudes show similar profiles in their dependency on temporal frequency under the same luminance. A and B: data are average (±SD) frequency-response functions of the 1st H components (log) obtained under L*-cone (A; n = 5–11, except at 13 cd/m2, where n = 1–4)- and rod-isolating conditions (B; n = 2–10) in LIAIS mice. Only the highest contrasts (55 and 75%; black squares) were obtained at 13 cd/m2 (bottom), whereas data from all 3 contrasts were collected at 39 (middle) and 130 cd/m2 (top). C: data sampled across temporal frequencies from the top 2 mean luminances are plotted against photoreceptor contrasts, with different symbols denoting various temporal frequencies sampled from A and B. Where applicable (goodness-of-fit; r2 ≥ 0.90), plots were modeled with (solid black) linear regression lines. Amplitude depends approximately linearly on contrast when mean luminance is 39 cd/m2, whereas the relationship is more exponential (gray dashed lines) when mean luminance is 130 cd/m2. This trend is more prominent for cone- than for rod-driven responses. In comparison, the effect of mean luminance on these amplitudes was variable and not as strong. D: L*-cone (triangles; n = 11) vs. rod comparisons (squares; n = 10) as a function of temporal frequency can also be converted to show photoreceptor responsivity.

