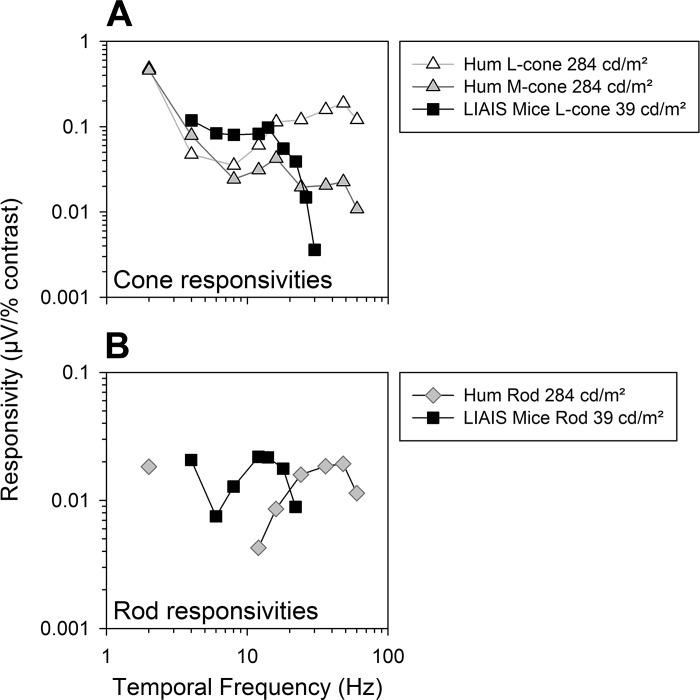
Fig. 6.
Differences are evident between data from LIAIS mice (from Fig. 4D) and human photoreceptor responsivities (n = 5; Kremers and Pangeni 2012). L-cone (A) and rod responsivities (B) for each species are shown as a function of temporal frequency.

