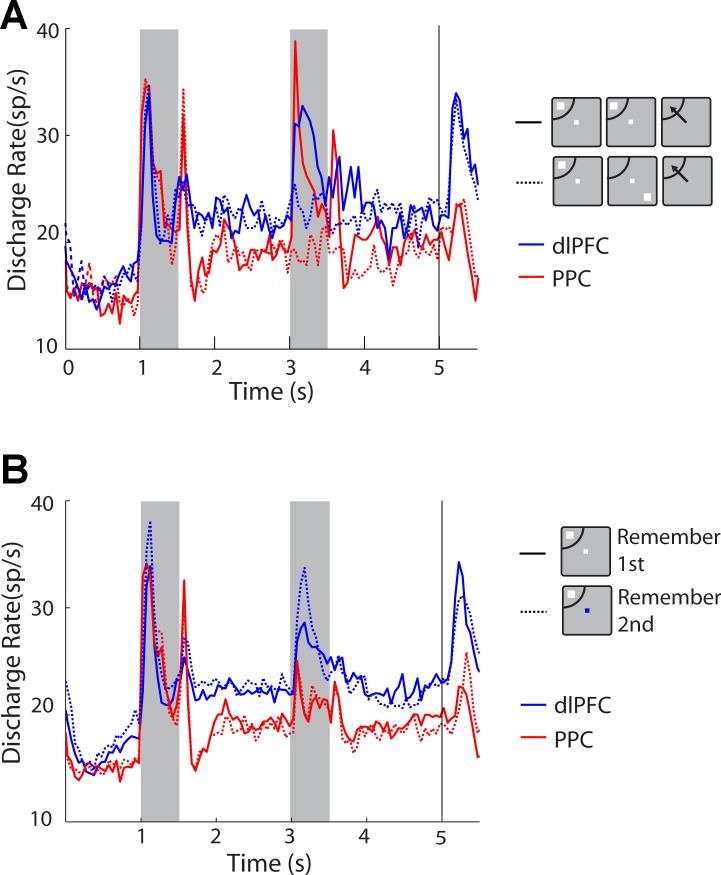
Fig. 2.
Population peristimulus time histograms (PSTH) averaging activity from dlPFC and PPC neurons with significant delay period activity in the randomized distractor task. A: discharge rate data are plotted for the remember-first task with the first stimulus appearing in the receptive field and the distractor appearing either in the receptive field (solid lines) or out of the receptive field (dotted lines). Blue and red lines represent dlPFC and PPC, respectively (dlPFC, n = 75; PPC, n = 85). B: population PSTH for the same set of neurons as in A comparing activity in the remember-first (solid lines) and remember-second (dotted lines) tasks. sp/s, Spikes per second.

