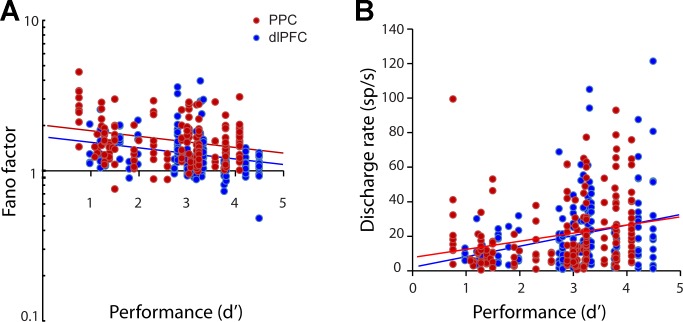
Fig. 7.
A: Fano factor in the stimulus presentation period is plotted as a function of behavioral performance (expressed as d′) in dlPFC (blue dots) and PPC (red dots). Each point represents the Fano factor of a single neuron, plotted against the performance during the session in which the neuron was recorded. Regression lines are shown (dlPFC, blue lines; PPC, red lines). B: discharge rate as a function of behavioral performance, plotted in the same fashion as in A.

