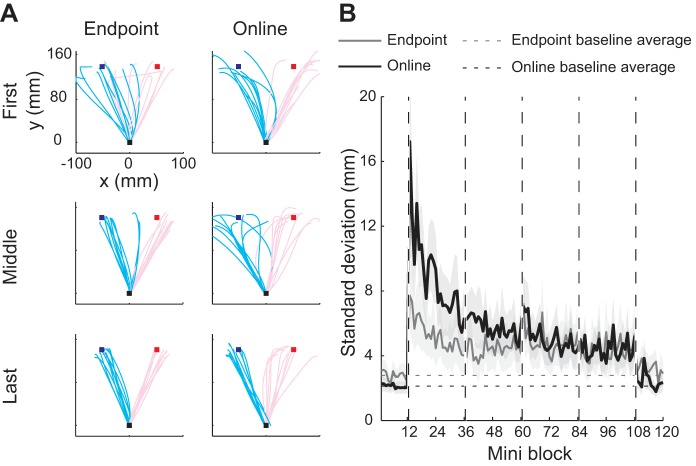
Fig. 2.
Online correction during the first phase of MR learning. A: movement trajectories from a representative participant from the endpoint (left column) and online (right column) feedback groups. The top panels indicate the first 20 trials of MR 1, the middle panels indicate the middle 20 trials of MR 1, and the bottom panels indicate the last 20 trials of MR 1. Red lines indicate individual trajectories for trials aiming to the red target, and blue lines indicate individual trajectories for trials aiming to the blue target. B: standard deviation of the position perpendicular to the main movement direction as a measure of online movement corrections. Solid gray line indicates the endpoint feedback group, and solid black line indicates the online feedback group. Dashed horizontal lines indicate baseline average of each group.

