
Fig. 5.
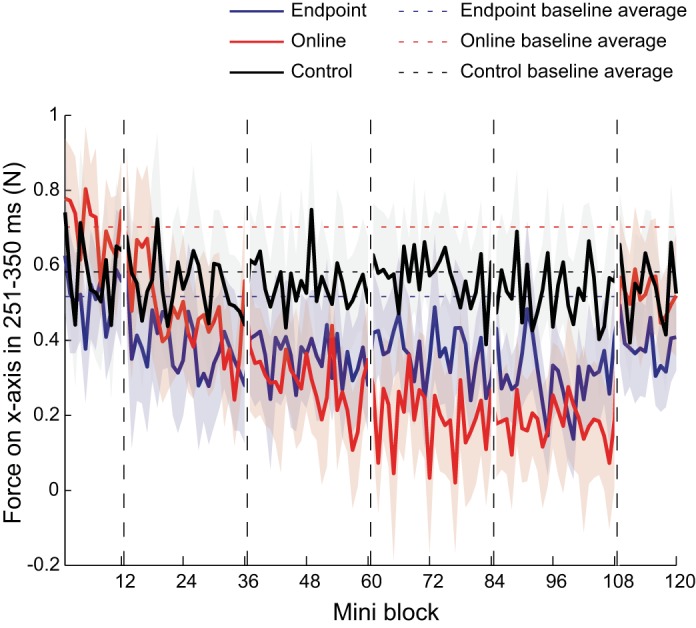
Magnitude of averaged visuomotor responses. Lines indicate mean force on x-axis produced in response to cursor displacements across all participants during the 251- to 350-ms interval after the onset of the perturbation. Solid blue line indicates the endpoint feedback group, solid red line indicates the online feedback group, and solid black line indicates control group. Dashed horizontal lines indicate baseline average of each group. The shaded colored region indicates ± 1 SE across participants.