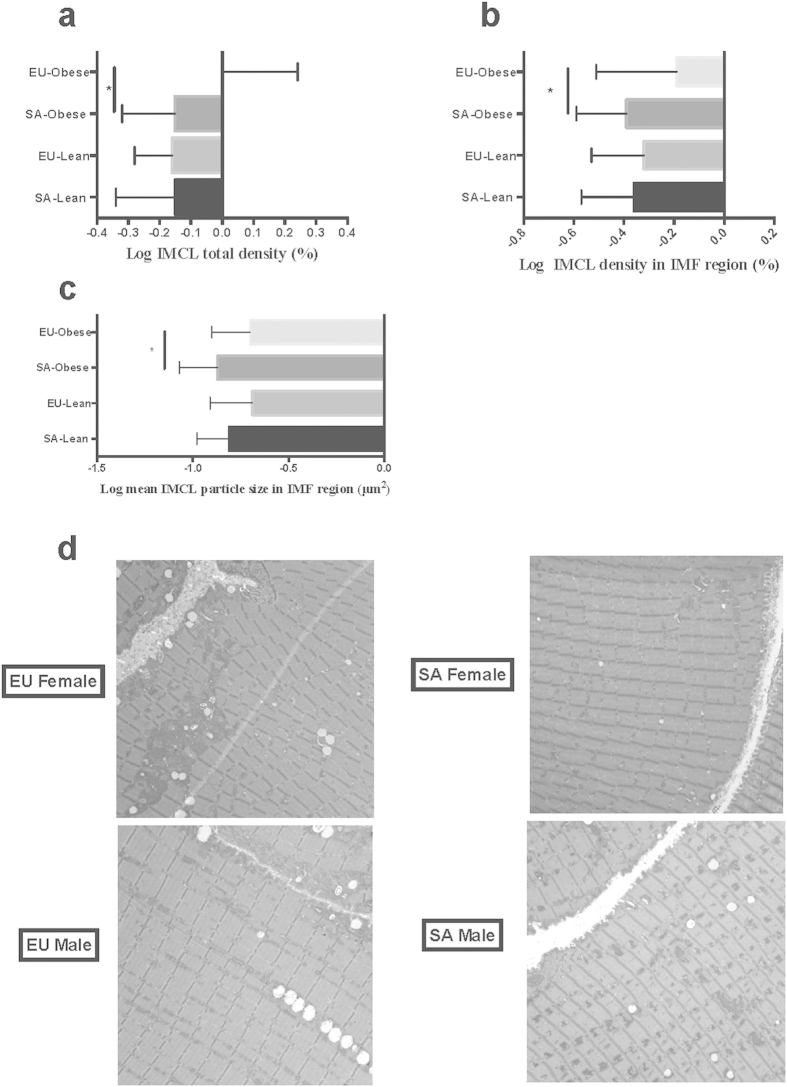
Figure 1. Obese SA have smaller IMCL particles in IMF compared to EU.
(a) Log IMCL total density (%); (b) Log IMCL density in IMF region (%); (c) Log mean IMCL particle size in IMF region (μm2); (d) Representative electron microscopy images for IMCL for SA and EU males and females.

