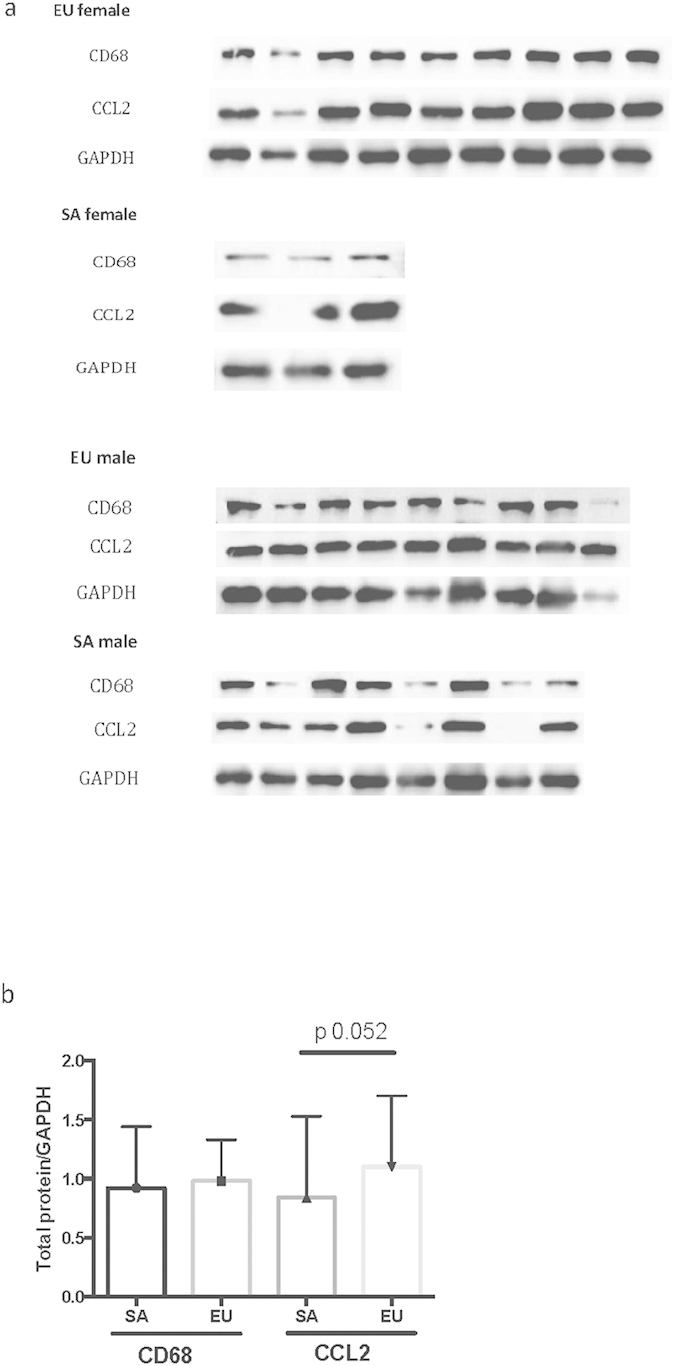
Figure 3. Muscle protein expression of CD68 and CCL2 in SA and EU.

(a) Western blot data for CD68, CCL2, and GAPDH as control. CD68 produces a band at 110 kDa, CCL2 30 kDa, and GAPDH 37 kDa. (b) Quantification of western blot result.

(a) Western blot data for CD68, CCL2, and GAPDH as control. CD68 produces a band at 110 kDa, CCL2 30 kDa, and GAPDH 37 kDa. (b) Quantification of western blot result.