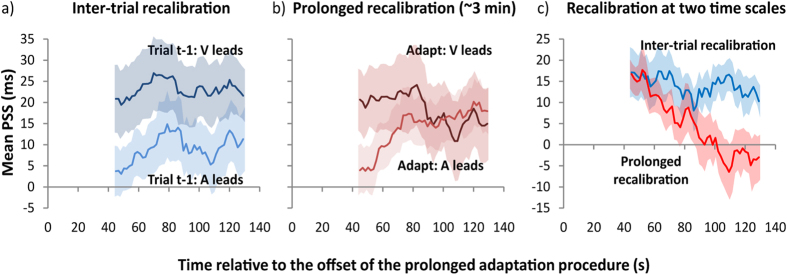
Figure 3. Recalibration at two different time scales.

(a) Inter-trial adaptation effects: Mean point of subjective simultaneity (PSS) as a function of time since offset of prolonged adaptation plotted separately for both types of modality order on trial t-1 (i.e., vision led or audition led). Note that 0 s indicates adaptation offset and the first data point is located at the temporal midpoint of the 50 trials in the moving window of analysis. The light blue curve shows PSSs for trials in which audition led on trial t-1 and the dark blue curve shows PSSs for trials in which vision led on trial t-1. (b) Effects of prolonged adaptation: Mean PSS as a function of time since offset of prolonged adaptation plotted separately for both types of modality order during adaptation. The light red curve shows PSSs for trials in which audition led vision by 200 ms during adaptation, and the dark red curve shows PSSs for trials those trials in which vision led audition by 200 ms during adaptation. (c) Inter-trial and prolonged recalibration as a function of time since adaptation offset. The blue curve plots the rapid recalibration effect (i.e., ΔPSS = PSS vision leads on trial t-1—PSS audition leads on trial t-1). The red curve plots the prolonged recalibration effect (i.e., ΔPSS = PSS vision leads during initial adaptation—PSS audition leads during initial adaptation). In Fig. 3, a negative PSS indicates that audition leads vision, whereas a positive PSS indicates that vision leads audition. All error bars represent ± 1 s.e.m.
