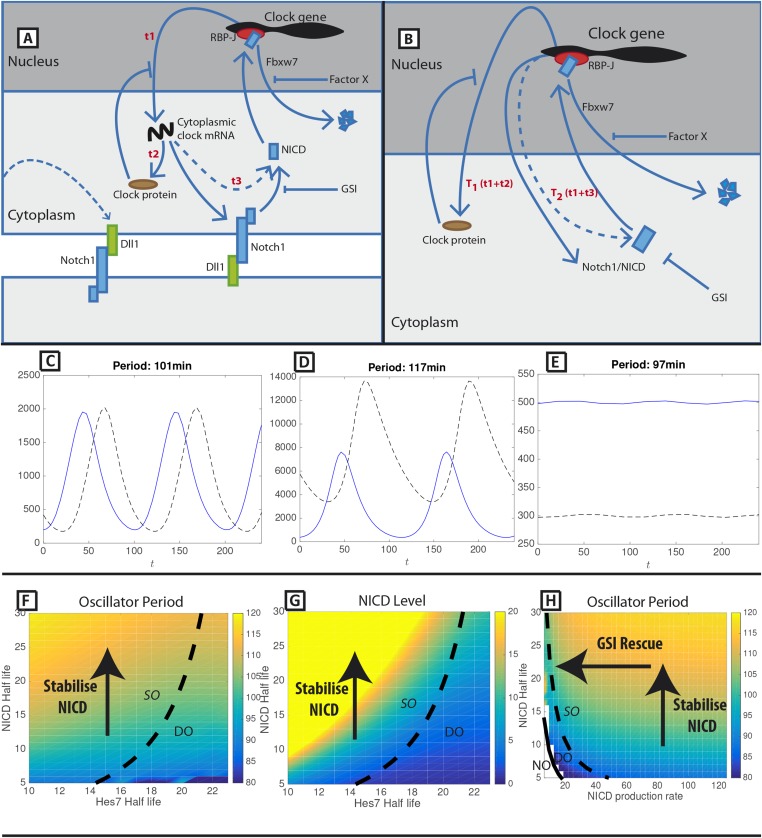
Figure 1. A mathematical model of positive and negative regulation of the somitogenesis clock.
(A) A schematic illustration of inter-cellular coupling via Delta-Notch signalling. (B) A schematic illustration of the reduced model in which the pulsatile production of NICD is down stream of clock gene expression. (C–E) Representative numerical solution of the model Equations (1)-(3). Clock protein (p(t), solid line) and NICD (n(t), dashed line) levels are plotted against time. (C) 'Wild-type' oscillations (k_4 = 0.063), (D) Decreasing NICD decay rate yields longer period oscillations (k_4 = 0.023), (E) Decreasing Hes7 decay rate lowers levels of Hes7 and NICD (k_2 = 0.035). (F) The oscillation period (colour) is plotted against Hes7 and NICD half-lives. (G) NICD level is plotted against Hes7 and NICD half-lives. (H) Oscillator period is plotted against NICD production rate and half-life. (E–G) Solid lines depict emergence of the non-trivial steady-state. Dashed lines depict points in parameter space where the nontrivial steady state undergoes a Hopf bifurcation. Damped Oscillations (DO), Stable Oscillations (SO), No Oscillations (NO). Unless otherwise stated, parameter values are: k1=123 min−1, k2=0.058 min−1, k3=134 min−1, k4=0.063 min−1, T1=44.0 min, T2=67.0 min, KP=125, KN=125.

