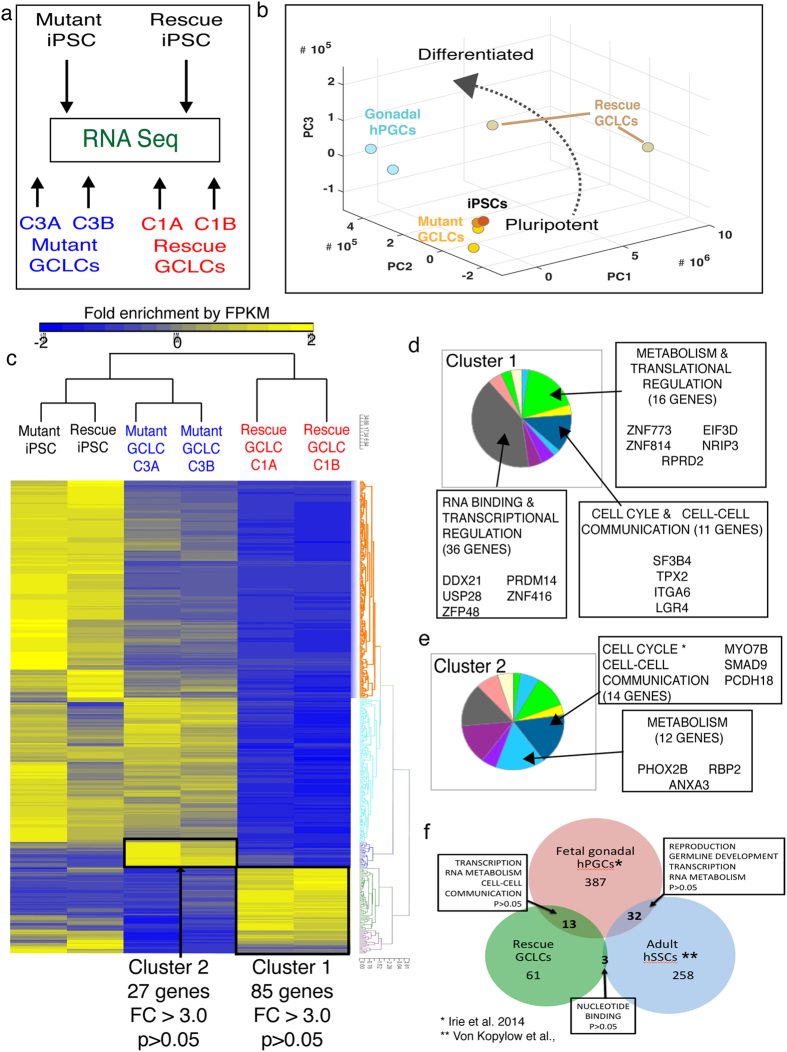
Figure 4. Global gene expression analysis of GCLCs by RNA sequencing and correlation with human endogenous germ cells.
(a) Schematic of RNA sequencing analysis in two donor iPSC lines and two xenograft replicates each of AZFa-deleted mutant GCLCs (mutant GCLCs) and DDX3Y-rescue GCLCs (rescue GCLCs). (b) Three-dimensional (3D) Principal Component Analysis (3D-PCA) of global transcript levels in donor iPSCs, mutant GCLCs, rescue GCLCs and human gonadal PGCs (week 7-old embryo). (c) Hierarchically clustered heat map displaying fold enrichment of all differentially expressed transcripts between the 6 samples after RNA sequencing. Clusters 1 and 2 indicate regions of interest that were submitted for GO analysis in (D). (d) Gene Ontology (GO) analysis by PantherDb software of cluster 1, genes up regulated in two replicates of rescue GCLCs versus two replicates of mutant GCLCs. GO categories are summarized in a pie chart and call-out boxes highlight genes of interest. All genes were up regulated by fold changes >3.0. (e) GO analysis by PantherDb software of cluster 2, genes up regulated in two replicates of mutant GCLCs versus two replicates of rescue GCLCs. GO categories are summarized in a pie chart and genes of interest are highlighted by call-out boxes. (f) Venn diagram representing relationship between genes up regulated by fold change of 2.0 or greater and with significance p < 0.05 in cluster 1 of rescue GCLCs, embryonic PGCs (Irie et al., 2015) and adult SSCs (Von Kopylow et al., 2010). Overlapping genes in various segments of Venn diagram were categorized by GO analysis using PantherDb and indicated in call-out boxes.

