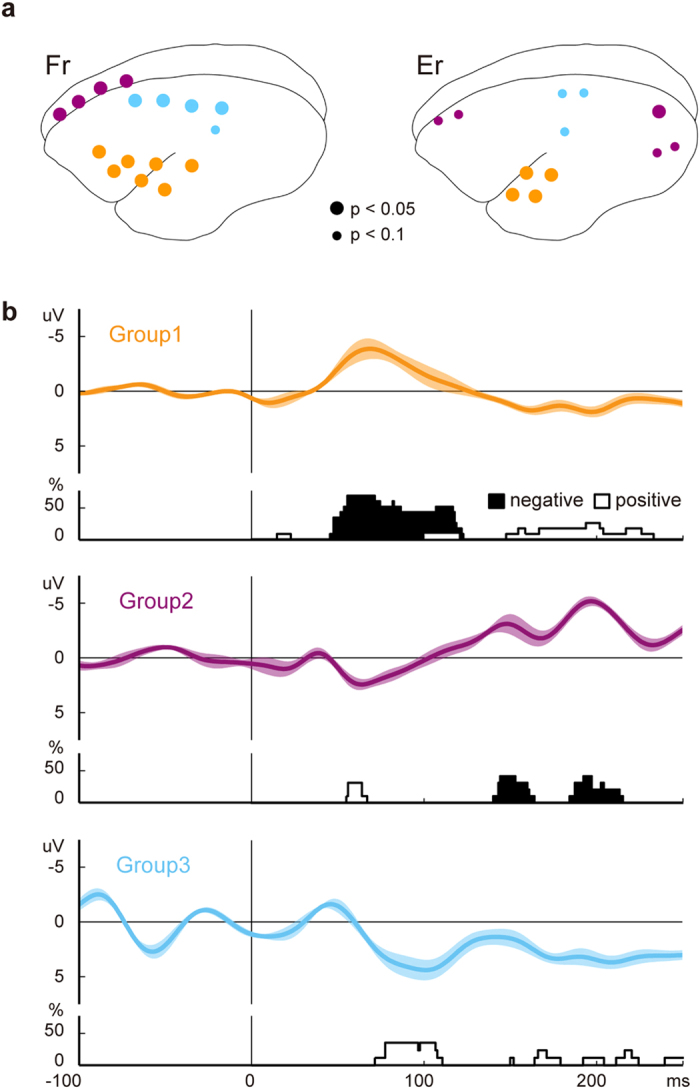
Figure 3. Spatiotemporal distribution of the difference between standard and deviant ERPs.

(a) The spatial distribution of the electrodes that revealed significant differences between standard and deviant ERPs. We divided these electrodes into three groups (orange, purple, and light blue). (b) The grand average waveforms and the histograms of the temporal distribution of significant differences in each group. The shaded area indicates the range of SDs of the waves. The height of histograms shows the percentages of significant ERPs (FDR-adjusted p-value < 0.1) in each group at each time point. The filled and open histograms indicate the electrodes that had negative and positive components in their difference waves, respectively. The difference first occurred in temporal electrodes, and then appeared in other cortical areas.
