FIGURE 10.

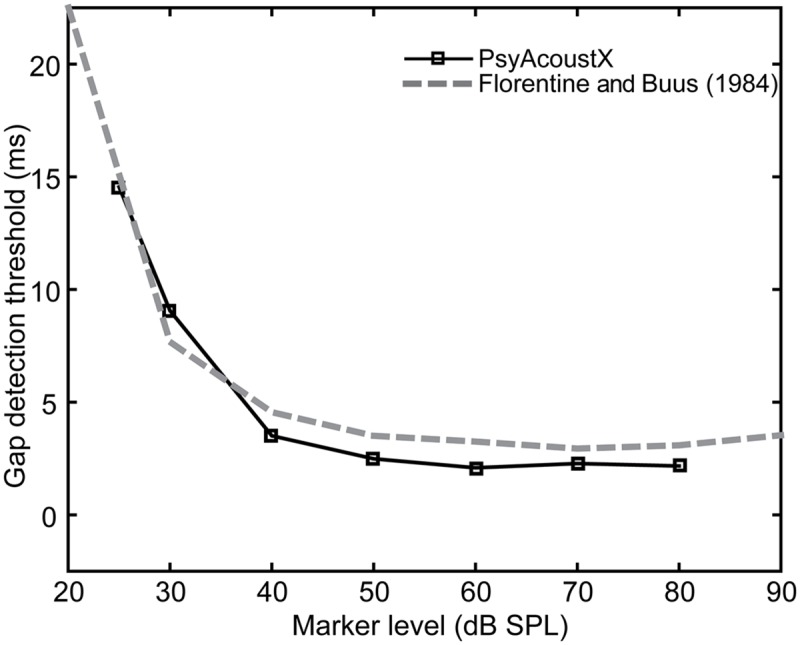
Representative gap detection thresholds (GDTs) as a function of marker level. Squares are data collected using PsyAcoustX in one normal hearing subject. Data from Florentine and Buus (1984) are shown for comparison.

Representative gap detection thresholds (GDTs) as a function of marker level. Squares are data collected using PsyAcoustX in one normal hearing subject. Data from Florentine and Buus (1984) are shown for comparison.