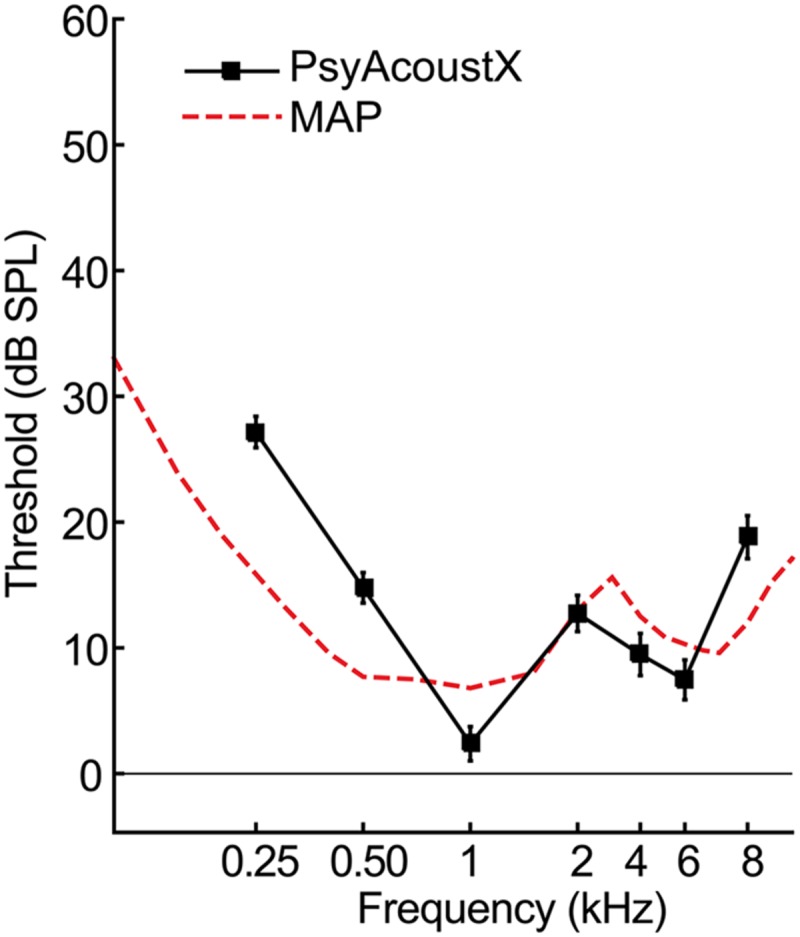
FIGURE 6.

Representative audiometric hearing threshold data. Average air conduction hearing thresholds (i.e., audiograms) for n = 17 normal hearing listeners. Also shown for comparison is the minimum audible pressure (MAP, dashed line; Killion, 1978), representing auditory thresholds measured under headphone listening. Audiometric thresholds measured via PsyAcoustX agree well with those measured via other hardware/software platforms. Errorbars = ±1SEM.
