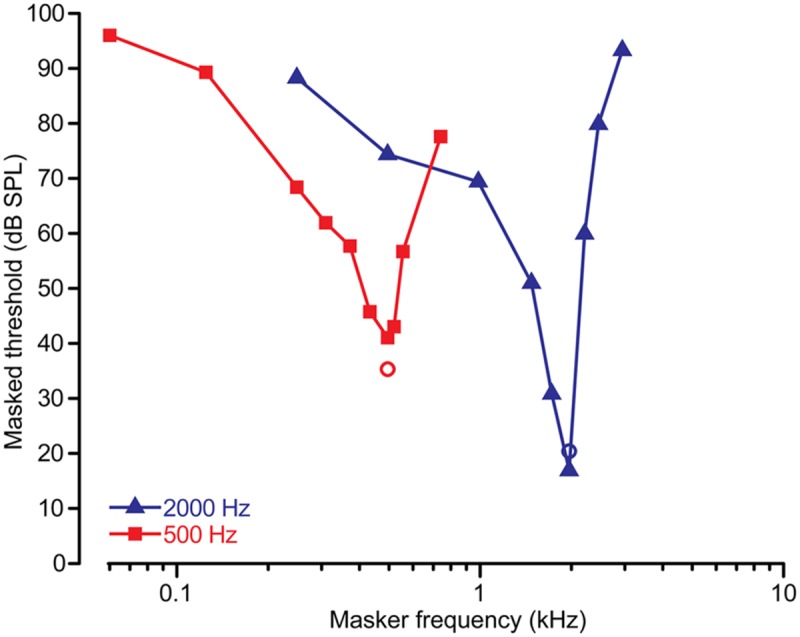
FIGURE 9.

Representative psychophysical tuning curve (PTC) data. PTCs were measured for signal frequencies of 500 and 2000 Hz using a forward masking paradigm (Bidelman et al., 2014). Circles show the level and frequency of the probe. PTCs show the typical “V-shape” with a low-frequency tail, highly selective tip, and steep high-frequency skirt characteristic of auditory filters. Also apparent is the higher quality factor (i.e., sharpness) in human tuning for higher compared to lower characteristic frequencies (CFs) (Shera et al., 2002).
