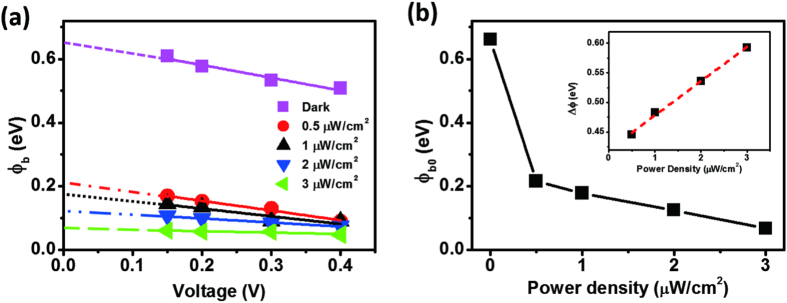
Figure 6.
(a) Plot of the values of φb with respect to applied voltage under illumination with UV light at various power densities. (b) Values of φb0 plotted with respect to the illumination power density; data were obtained from (a); inset: plot of Δφb0 (the difference between the values of φb0 under UV light and in the dark) with respect to the power density of the UV light.

