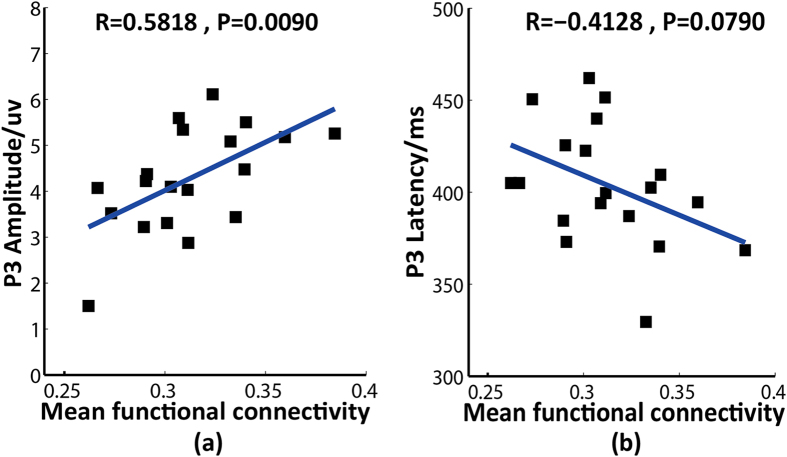
Figure 1. Relationships between the mean functional connectivity and P3 amplitude/latency.
(a) The mean functional connectivity vs. P3 amplitude. (b) The mean functional connectivity vs. P3 latency. In each sub-figure, the blue line is the fitted curve; R indicates the correlation coefficient, and P indicates statistical significance.

