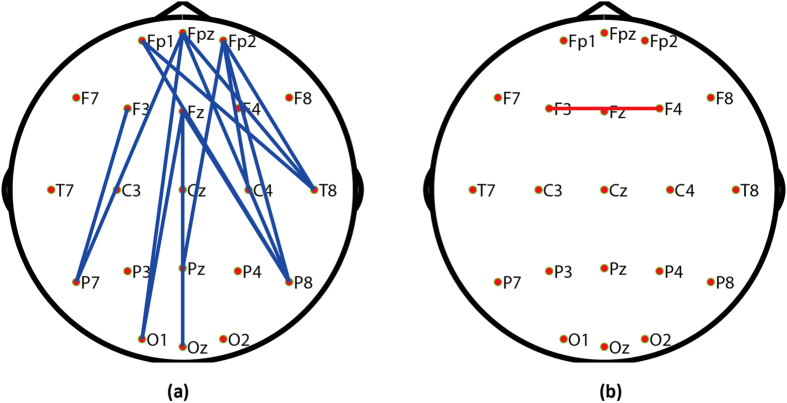
Figure 3. Topography of the edges whose strengths were significantly related to P3 amplitude and the corresponding latency.
(a) Edges that were significantly correlated with P3 amplitude (p < 0.01). (b) Edges that were significantly correlated with P3 latency (p < 0.01). In each sub-figure, blue edges indicate positive correlations between two variables, and red edges represent negative correlations between two variables.

