
Figure 6. Definitions of P3 amplitude and the corresponding latency.
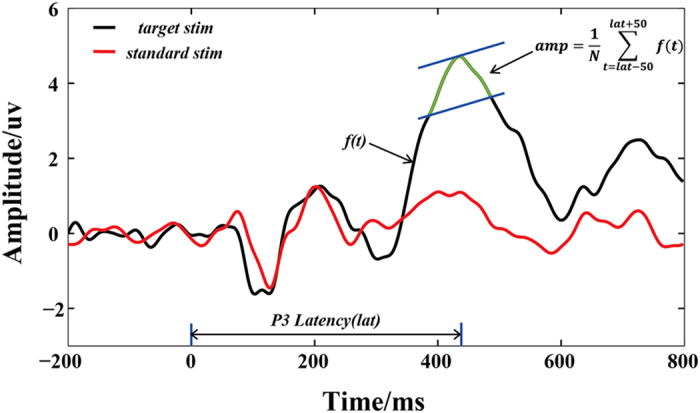
The P3 amplitude represents the mean value of 51 sample points, whereas the P3 latency represents the time interval between stimulus onset and the largest positive P3 peak.
Official websites use .gov
A
.gov website belongs to an official
government organization in the United States.
Secure .gov websites use HTTPS
A lock (
) or https:// means you've safely
connected to the .gov website. Share sensitive
information only on official, secure websites.
The P3 amplitude represents the mean value of 51 sample points, whereas the P3 latency represents the time interval between stimulus onset and the largest positive P3 peak.