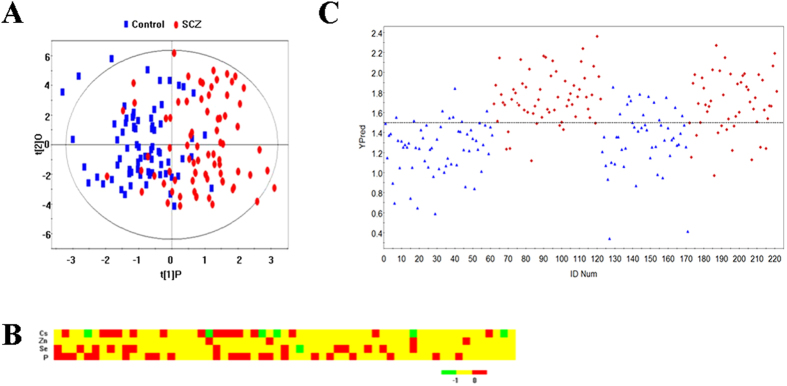
Figure 1. 35 elements profile for Schizophrenia.

(A) Scores plots of orthogonal projection to latent structures (OPLS) models discriminating Schizophrenia patients and healthy controls, each symbol represents an individual subject and the corresponding spatial distribution of these symbols reveals similarities and dissimilarities among the subjects. (B) Totally four elements are identified with variable importance on a projection (VIP) >1.5. (C) Scatter plot of prediction by OPLS model from the training group. Blue triangle represents samples in the training group; red diamond represents samples in the test group. For each group, the first set represents controls and the second set represents Schizophrenia patients. Controls and patients are assigned to Y = 1 and 2, respectively. Ypred shows Y value predicted of whole samples by the model constructed with the training group.
