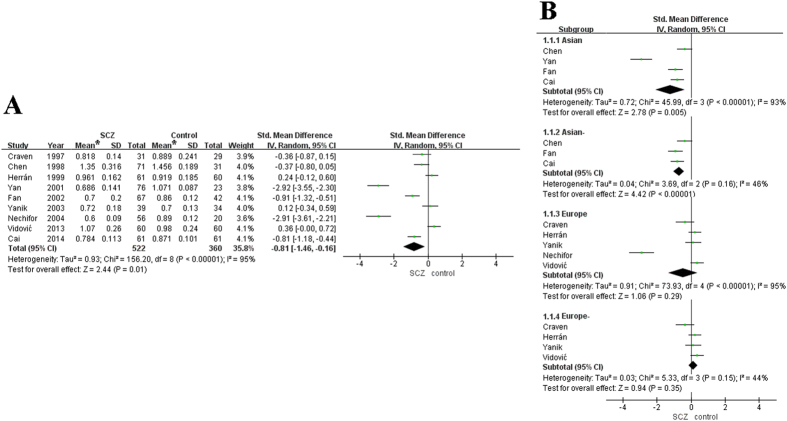
Figure 2. Meta-analyses of association between Zn and schizophrenia.
(A) Analysis with the whole studies. (B) Subgroup analysis based on the Asian and European populations. The heterogeneity test results are represented by chi2 and I2. The diamond represents the summary standardized mean difference (SMD) and 95% CI. The squares and horizontal lines correspond to the study-specific SMD and 95% CI. The area of the squares reflects the corresponding weight in the meta-analyses. *mg/L.

