Figure 3.

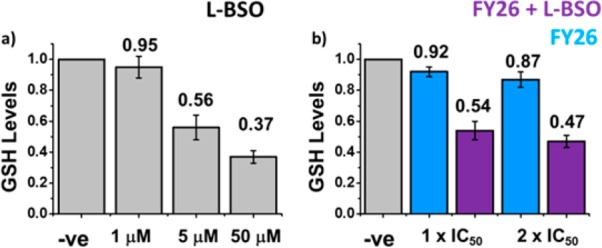
GSH levels in A2780 cells exposed for 24 h to (a) L-BSO (1, 5, and 50 μM), (b) FY26 (IC50 and 2× IC50) ± 5 μM L-BSO. In all cases, data have been normalized against negative untreated controls.

GSH levels in A2780 cells exposed for 24 h to (a) L-BSO (1, 5, and 50 μM), (b) FY26 (IC50 and 2× IC50) ± 5 μM L-BSO. In all cases, data have been normalized against negative untreated controls.