
Figure 3.
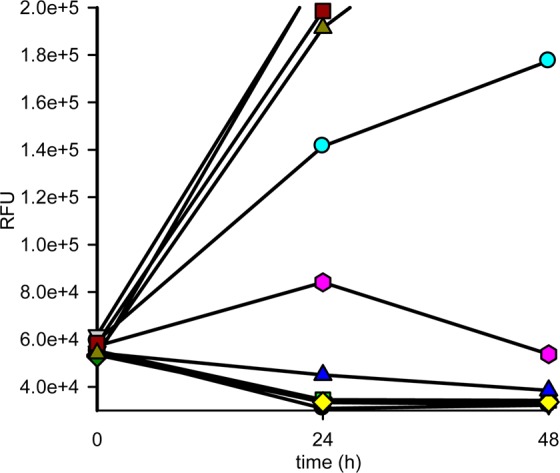
Static-cidal profile for 1. T. brucei bloodstream form parasites were exposed to 10 concentrations of compound 1, and the effect on parasite numbers was measured at 24 and 48 h post compound exposure. A negative slope indicates cidal activity at that concentration. Concentrations are as follows (μM): (black circles) 50, (red triangles) 17, (green squares) 5.6, (yellow diamonds) 1.9, (blue triangles) 0.6, (magenta hexagons) 0.2, (cyan circles) 0.07, (violet squares) 0.01, (olive green triangles) 0. RFU = relative fluorescence units.