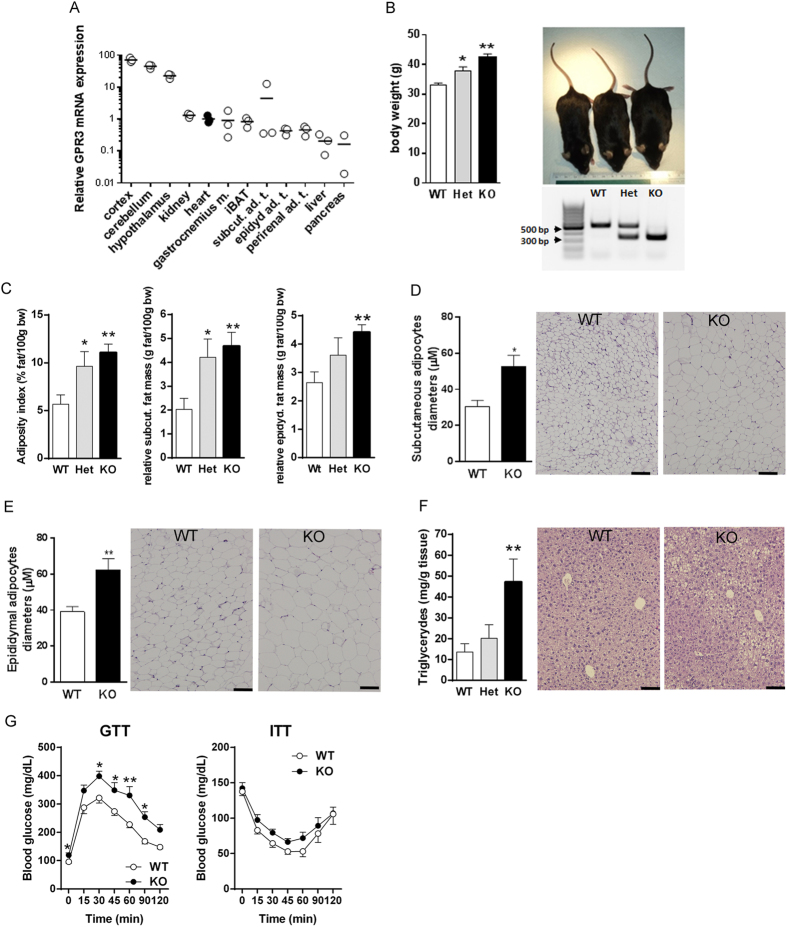
Figure 1. Phenotype differences among GPR3 mice.
(A) Tissue expression profile of GPR3 mRNA in 12- week-old wild type male mice. Each circle represents a single value relative to heart (filled circles). (B) Body weights of 1-year-old male wild type (WT), heterozygous (Het) and knockout (KO) mice along with genotyping results and representative images of WT (33.29 g), Het (36.52 g) and KO (41.48 g) mice. Values are mean ± s.e.m of n = 16–19 animals. *P < 0.05, **P < 0.01, ***P < 0.001 compared to age-matched WT littermates. (C) Adiposity index, relative mass of subcutaneous fat and epididymal fat, (D) subcutaneous adipocyte diameters, (E) epididymal adipocyte diameters and (F) liver triglyceride level in GPR3 WT, Het and KO mice. Values are mean ± s.e.m of n = 7–14 samples. *P < 0.05, **P < 0.01 compared to age-matched WT littermates. Panels D-F are accompanied by the representative H&E stained tissue sections. Pictures were taken at 10x magnification (scale bar indicates 100 μm). (G) Glucose tolerance (GTT) was tested after intraperitoneal (i.p.) injection of 1.5 g/kg glucose (at 0 min; (A) to the overnight-fasted 12-month-old male GPR3 WT and KO mice. On the following day, mice were fasted for 6 hour and received 0.75 mU/g insulin i.p. at time 0 (insulin sensitivity test; ITT). Changes in blood glucose level were monitored for 2 hours. Values are mean ± s.e.m of n = 8–14 samples. *P < 0.05, **P < 0.01 compared to age-matched WT littermates.

