
Figure 2. Between group disparities in odds of awareness of physical activity and cancer riska.
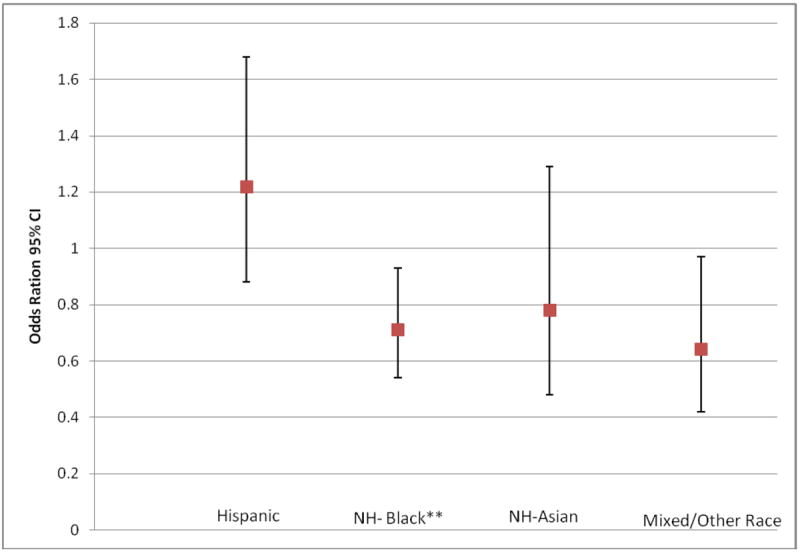
a Odds ratios and 95% confidence intervals are displayed for race/ethnicity when awareness was regressed on race/ethnicity (ref: White), age (ref:75+), gender (ref:female), education (ref: college), mode (ref:RDD), activity level (ref:inactive), trying to lose weight (ref:no), and cancersurvivor (ref:no); * p<0.05, **p<0.01