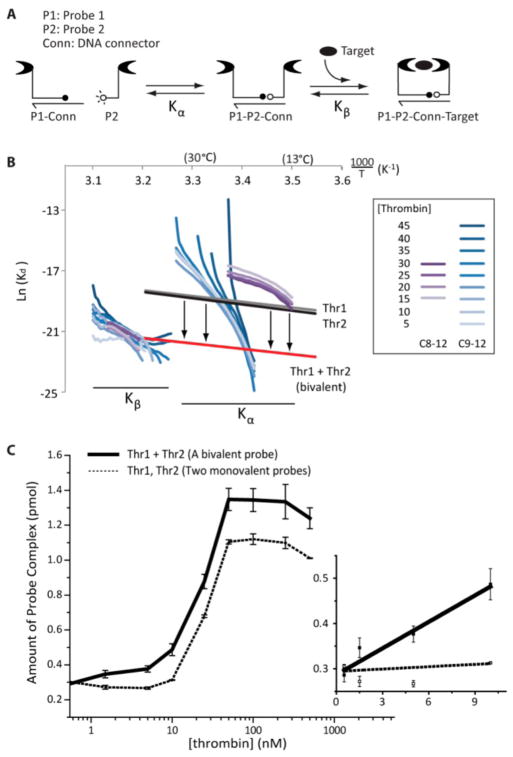
Figure 3.
Modeling and exploitation of bivalency in TFAB. (A) The TFAB model consisted of two consecutive binding events that were decoupled, represented by Kα and Kβ. (B) A Van’t Hoff plot showing thrombin TFAB processed through the model system. (C) Comparison of novel isothermal bivalent assay (solid line) with its monovalent counterpart (dotted line) showed an order-of-magnitude improvement in dynamic range with bivalent probes.

