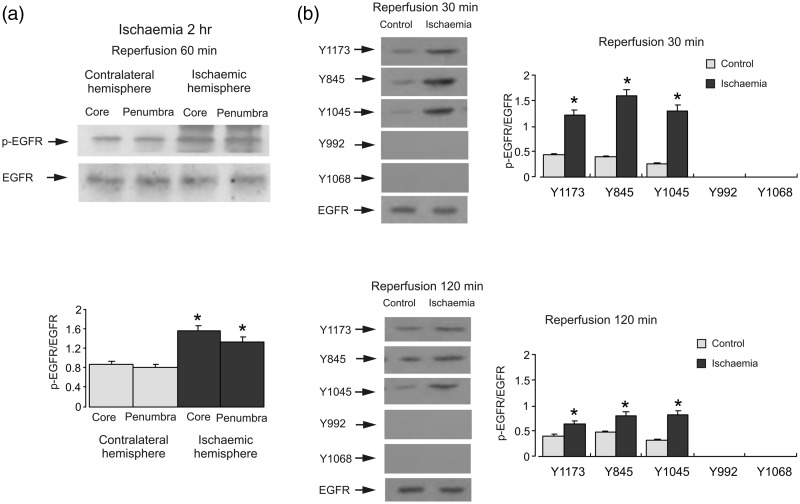
Figure 5.
EGFR phosphorylation during reperfusion. Two hr of focal ischemia was followed by 1- (a), 0.5- or 2-hr (b) reperfusion. (a) Bands of 170 kDa represent phosphorylated tyrosine of EGFR (pEGFR; upper rows) or total EGFR (lower rows). (b) Bands of 170 kDa represent pY1173, pY845, pY1045, pY992, or pY1068 (phosphorylated Y1173, Y845, Y1045, Y992, and Y1068 of EGFR; upper rows) or total EGFR (lower rows). Immunoblots from a representative experiment. Similar results are obtained from three independent experiments. Average EGFR phosphorylation is quantified as ratios between pEGFR and EGFR. SEM values are indicated by vertical bars. *Statistically significant (p < .05) difference from contralateral hemisphere. EGFR = epidermal growth factor receptor; pEGFR = phosphorylated tyrosine of EGFR.

