
Fig. 3.
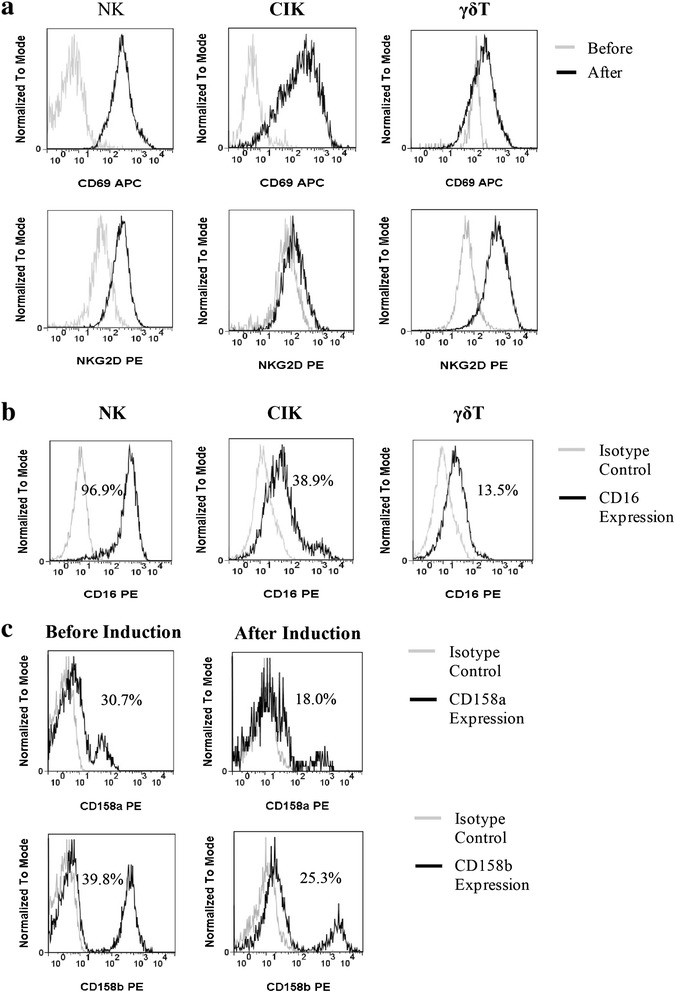
Expression of CD69, NKG2D, and KIR on induced immune cells. a The expression of CD69 and NKG2D were analyzed by flow cytometry (gray histogram). CD69 and NKG2D expression peaks are shifted to the right in expanded cells versus pre-induction cells (black histogram). b Expression of CD16; gray histograms depict isotype controls. c Expression of KIR (CD158a and CD158b) on NK cells before and after induction. Gray histograms depict isotype controls and the black histogram depicts the specific antibody. Data from one representative patient is shown