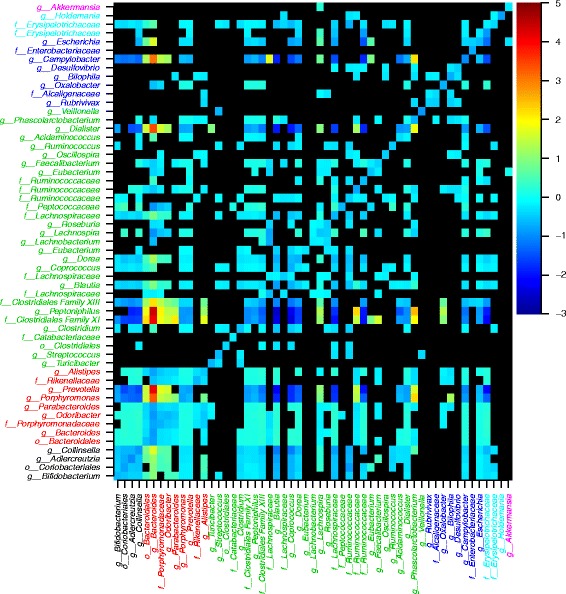
Fig. 1.

Genus level bacterial interactions for I1. The heat map describes the strength and direction (β i,j in Eq. 1) of highly significant interactions. Dependent variables are along the y axis and independent variables along the x axis, i.e. if you follow the column of given genus upward from the x axis until you reach a coloured cell, that cell indicates the effect of the given genus (dependent) on the genus indicated on the y axis (independent). The colour key on the right-hand side indicates the sign and magnitude of interactions that were significant at the 99 % confidence level. Cells representing non-significant relationships are black. Genus names are coloured according to phylum provenance: black Actinobacteria, red Bacteroidetes, green Firmicutes, blue Proteobacteria, light blue Tenericutes, and pink Verrucomicrobia. Note that according to the NCBI taxonomy database, the family Erysipelotrichaceae and the genus Holdemania are classified as Firmicutes. Here, and throughout, we have remained consistent with the Greengenes classification of these taxa as Tenericutes
