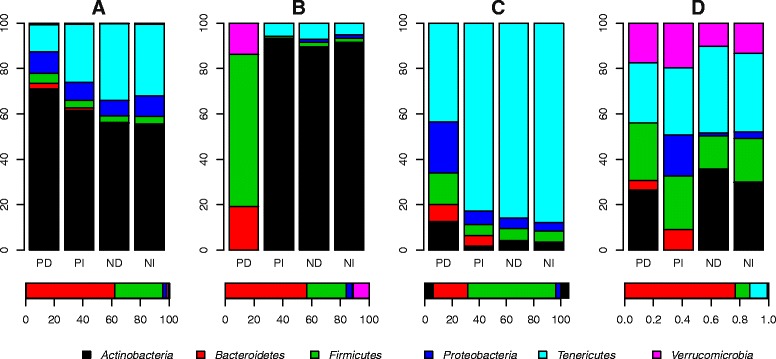
Fig. 5.

Phylum level degree of connectedness divided by relative abundances. The bars show the number of positive dependent (PD), positive independent (PI), negative dependent (ND) and negative independent (NI) interactions observed within each of the six main phyla divided by the mean relative abundance of each phylum (horizontal bars below the panels). The ratios have been converted to percentages. a–d show data for I1-4, respectively
