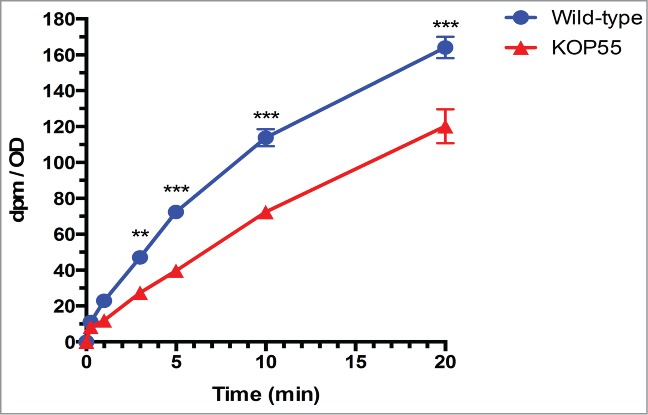
Figure 2.

Cholesterol uptake in M. bovis BCG. [4–14C]cholesterol uptake by wild-type and KOP55 mutant cells. Values are the mean and error bars indicate standard deviation of 3 replicates. Pair wise comparisons indicate statistically significant differences (**, P <0.005; ***, P<0.0001).
