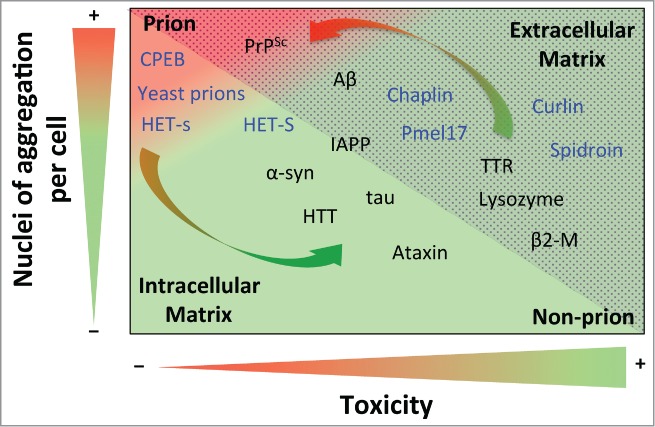
Figure 1.

Prion propensity of amyloid-prone proteins. Effect of the number of aggregation nuclei per cell and cytotoxicity on the capacity of amyloids to infect; from low transmission (green) to high infective capacity (red). The proteins included in the graph represent the different subclasses of amyloids from extracellular (dotted area) and intracellular (shaded area) matrices. The functional amyloids are in blue. The arrows show switching possibilities between prion and non-prion. Note that the location of the amyloid-prone proteins in the graph is only to illustrate their prion or non-prion tendency. Protein abbreviations: amyloid β-peptide (Aβ), prion protein (PrPSc), cytoplasmic polyadenylation element-binding protein (CPEB), α-synuclein (α-syn), huntingtin (HTT), islet amyloid polypeptide (IAPP), (Pmel17), transthyretin (TTR) and β2-microglobulin (β2-M).
